Figures & data
Figure 1 The various phases of the healing process.
Notes: After damage, inflammation leads to the formation of the granulation tissue, during which myofibroblasts appear. An important neoangiogenesis is also observed. On this granulation tissue, a new epidermis can then develop. Subsequently, remodeling of this granulation tissue occurs with apoptosis of the cells present in the granulation tissue (myofibroblasts and vascular cells) and reorganization of the extracellular matrix.
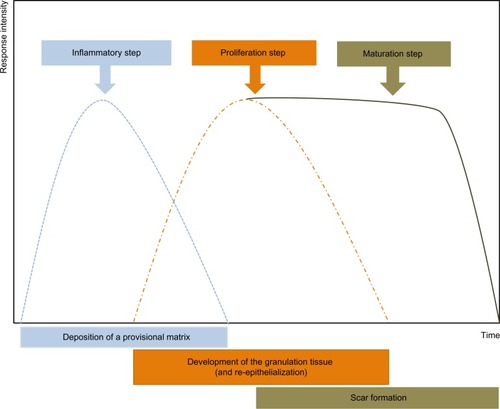
Figure 2 Schematic illustration showing the evolution of the (myo)fibroblast phenotype.
Notes: The myofibroblastic modulation of fibroblastic cells begins with the appearance of the proto myofibroblast, whose stress fibers contain only β- and γ-cytoplasmic actins and evolves, but not necessarily always, into the appearance of the differentiated myofibroblast, the most common variant of this cell, with stress fibers containing α-smooth muscle actin. Soluble factors, extracellular matrix components, and/or the mechanical microenvironment are involved in myofibroblastic differentiation. The myofibroblast can disappear by apoptosis; while deactivation leading to a quiescent phenotype has not been clearly demonstrated, at least in vivo.
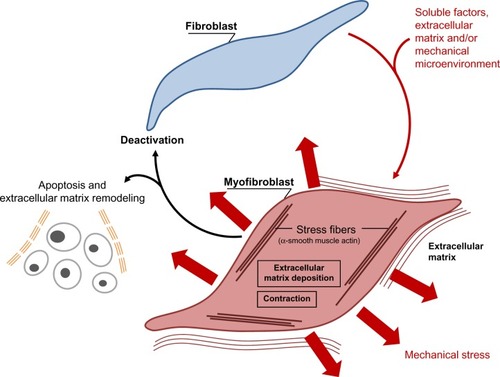
Figure 3 Pathological situations.
Notes: If the inflammation phase persists and the granulation tissue does not develop, a chronic wound may result. If the remodeling phase of the granulation tissue does not happen (neither apoptosis of the cells present in the granulation tissue, myofibroblasts, and vascular cells, nor reorganization of the extracellular matrix), myofibroblasts may persist, leading to pathological situations characterized by excessive scarring.
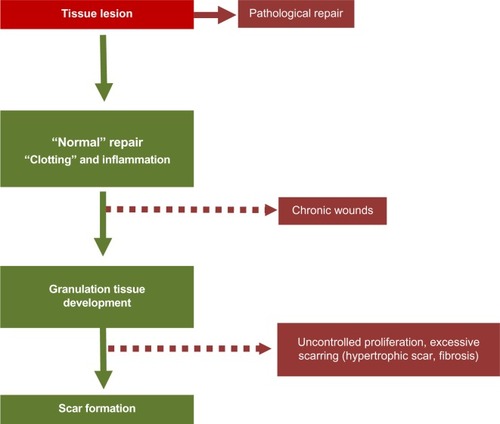
Figure 4 Processes leading to normal wound repair and pathological scarring.
Notes: In all of these situations, interactions between fibroblasts/myofibroblasts and the extracellular matrix, and also epithelial–mesenchymal cell dialogue, play a major role.
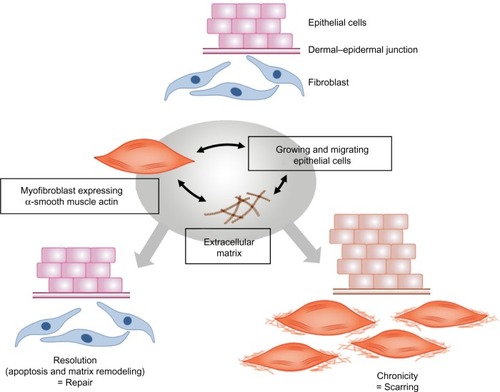
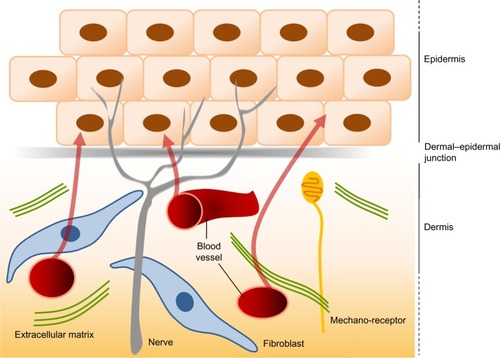
Figure 5 The interactions between the dermis and the epidermis.
Notes: The dermis and the epidermis contain nerves, but only the dermis is vascularized. The epidermis thus derives all its nutrients from dermal vessels (arrows). The dermal–epidermal junction plays a major role in the intense dialogue that exists between the keratinocytes of the epidermis and the cells of the dermis, notably the fibroblasts.