
Figures & data
Table 1 Distribution of volunteers among age classes and for the two subcohorts (sun-phobic and normal exposure)
Table 2 Description of the two subcohorts cohorts (sun-phobic and normal exposure) regarding the solar exposure behavior each day and week during volunteers’ lifetimes – according to the questionnaire completed by each subject
Figure 1 Clinical standardized photographic scale of “forehead pigmentation”.
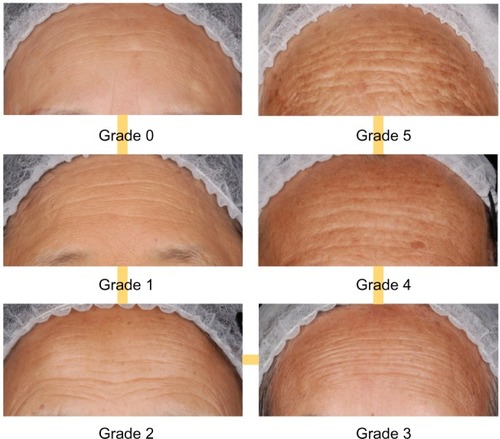
Figure 2 Clinical standardized photographic scale of “importance of facial skin surface texture presenting alteration”.
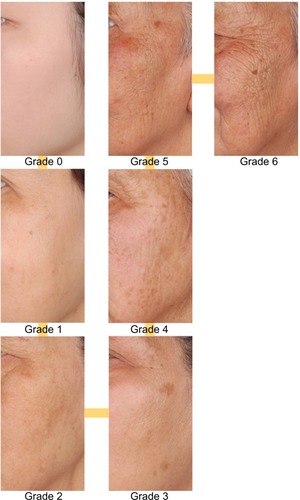
Table 3 New clinical signs to complete previously published clinical atlases. Correlations with real/chronological age, perceived apparent age, and photoaging status
Table 4 Clinical aging signs of the face, described by atlases. Correlations with real/chronological age, perceived apparent age, and photoaging status
Table 5 The four clinical clusters. Correlations with real/chronological age, perceived apparent age and photoaging status
Figure 3 Comparison of photoaging status scored with Chung’s scales.Citation5 Mean scores (±95% CI) for each age class between normal exposure and sun-phobic.
Abbreviations: S-P, sun-phobic; NE, normal exposure; CI, confidence interval.
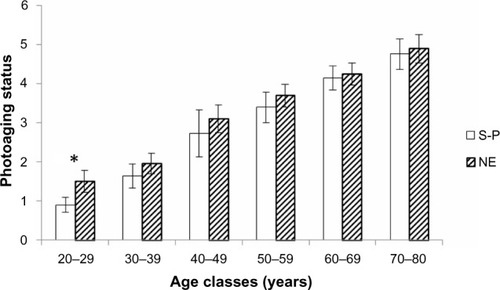
Figure 4 Comparison of wrinkles and skin texture. Mean scores (±95% CI) for each age class between normal exposure and sun-phobic.
Abbreviations: S-P, sun-phobic; NE, normal exposure; CI, confidence interval.
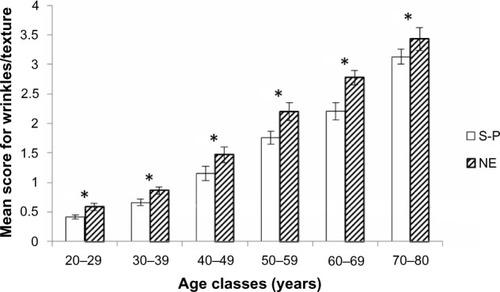
Figure 5 Comparison of pigmentation disorders. Mean scores (±95% CI) for each age class between normal exposure and sun-phobic.
Abbreviations: S-P, sun-phobic; NE, normal exposure; CI, confidence interval.
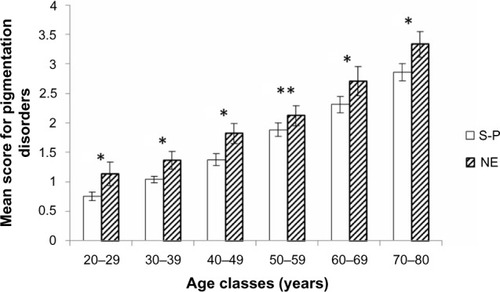
Figure 6 Comparison of ptosis and sagging. Mean scores (±95% CI) for each age class between normal exposure and sun-phobic.
Abbreviations: S-P, sun-phobic; NE, normal exposure; CI, confidence interval.
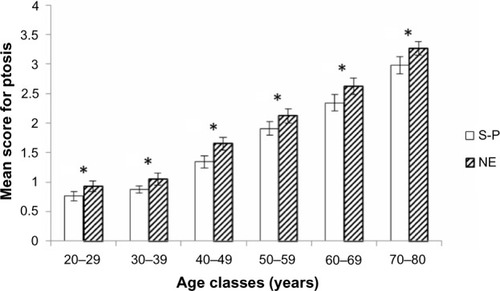
Table 6 Estimation of maximum clinical sun-induced damages vs real/chronological Asian facial skin aging for each age class in absence of specific prevention behavior: (Mean of fourth NE quartile – mean of first S-P quartile)/mean of first S-P quartile, that is, ([extrinsic + intrinsic] – intrinsic)/intrinsic
Figure 7 Difference between perceived apparent and real/chronological ages for each age class between normal exposure and sun-phobic. Mean differences (±95% CI).
Abbreviations: S-P, sun-phobic; NE, normal exposure; CI, confidence interval.
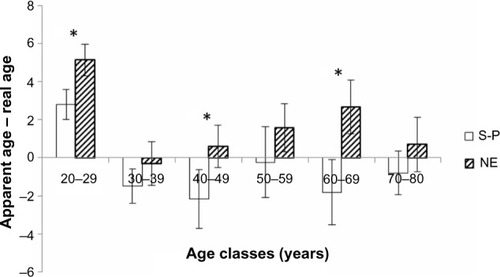
Table 7 Differences in perceived apparent age (younger/older than 3 years) between the two subcohorts of Chinese women (sun-phobic vs normal sun exposure)