
Figures & data
Table 1 Distribution of the 2,585 study subjects and their relative age ranges in the four countries where imaging of skin pores was performed
Table 2 Distribution of the 960 subjects claiming to have large skin pores and their relative age ranges in five countries, from which the 30% of subjects with the largest sP arbitrarily selected and analyzed in all age classes
Figure 1 Dermascore® device.
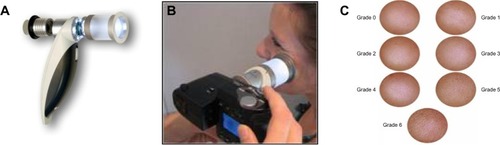
Figure 2 Impact of various input thresholds upon automatic detection of facial skin pores.
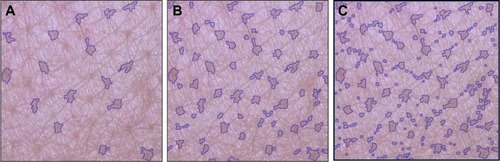
Figure 3 example of correlation obtained between clinical scorings and skin pore surface in 200 Chinese women, using a 250 μm threshold of detection.
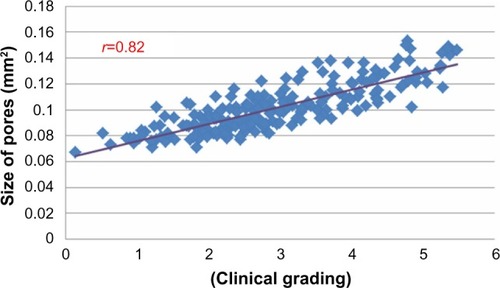
Figure 4 Changes in densities of skin pores with age and ethnic group.
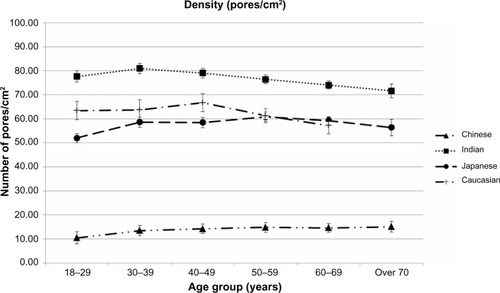
Figure 5 Changes in sizes of skin pores with age and ethnic group.
Notes: All 2,585 subject were included. Data expressed as mean values ±95% confidence intervals in each age class among ethnic groups.
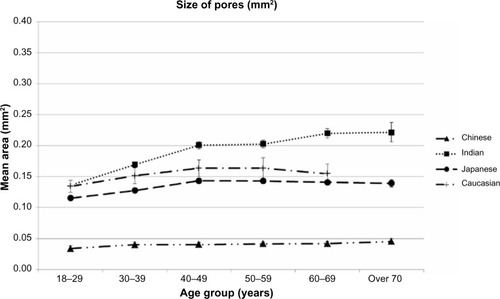
Figure 6 Changes in the relative skin surface covered by skin pores (as a percentage of total skin) with age and ethnicity.
Notes: All 2,585 subject included. Data expressed as mean values ±95% confidence intervals in each age class among ethnic groups.
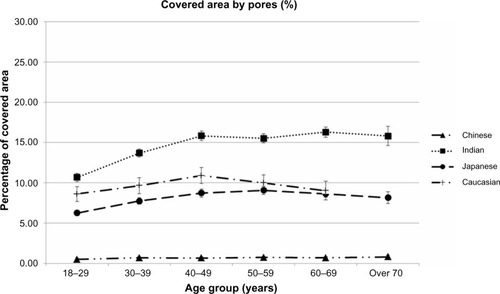
Table 3 Variable density of enlarged skin pores with ethnicity and age
Table 4 Variable areas of enlarged skin pores according to ethnics and age
Table 5 Percentages of skin surface covered by enlarged skin pores with age for five ethnic groups