
Figures & data
Figure 1 Skin surface curve obtained with a profilometer depicting Ry (wrinkle depth) and Ra (mean surface roughness).
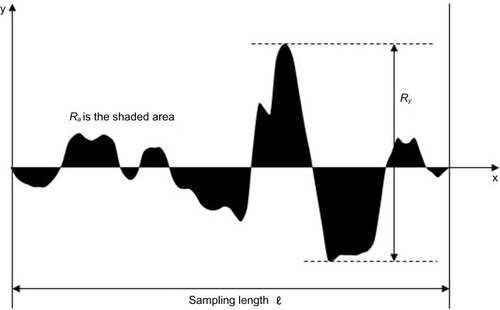
Figure 2 Skin deformation curve obtained with a cutometer depicting the immediate deformation or skin extensibility (Ue), delayed distension (Uv), final deformation (Uf), immediate retraction (Ur), total recovery (Ua), and residual deformation at the end of the measuring cycle (R).
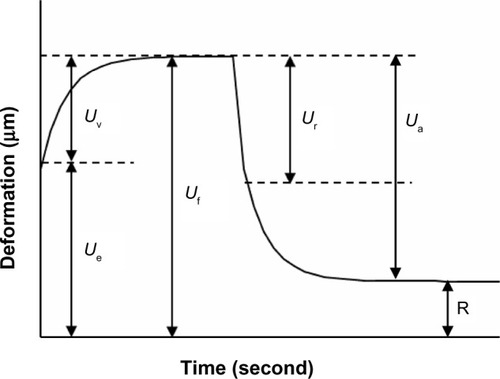
Table 1 Self-assessment questionnaire showing the percentage of positive responses from volunteers following an antiaging skin care regimen for 7, 14, and 21 days (n=52)
Figure 3 The percentage reduction in Ry (wrinkle depth) and Ra (mean surface roughness) versus time (days).
Abbreviation: SEM, standard error of mean.
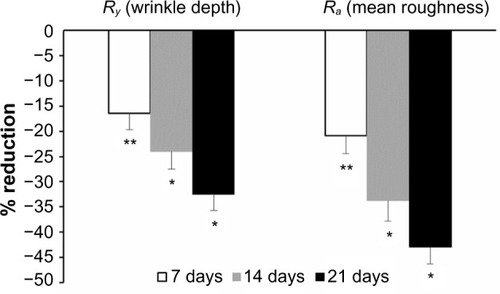
Table 2 Characterization of skin surface topography of the crow’s feet area antiaging
Figure 4 The percentage increase in skin elasticity parameters R2 (gross elasticity), R5 (net elasticity), R6 (viscoelastic portion), and R7 (recovery after deformation) versus time (days).
Abbreviation: SEM, standard error of mean.
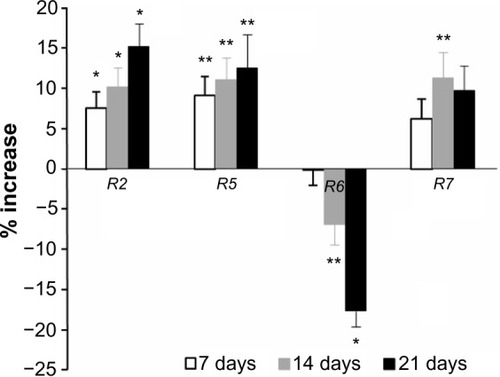
Table 3 Characterization of facial skin elasticity antiaging