Figures & data
Table 1 Demographics and baseline characteristics
Figure 1 Examples of a vector map for injection in (A) thighs, (B) abdomen, and (C) brachial zones.
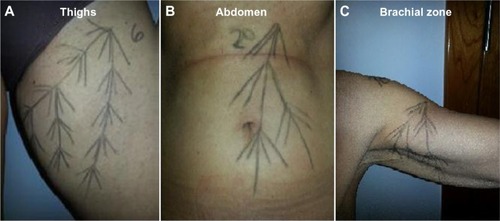
Figure 2 (A) Proportion of cutometer-evaluated skin flaccidity measurements that showed an improvement 5 weeks after treatment relative to baseline. (B) Representative cutometer trace from one subject who had their brachial zone treated, where red indicates before treatment and blue indicates after treatment. (C) Ultrascan trace recording density of the brachial zone skin from the same subject (left, before treatment; right, after treatment).
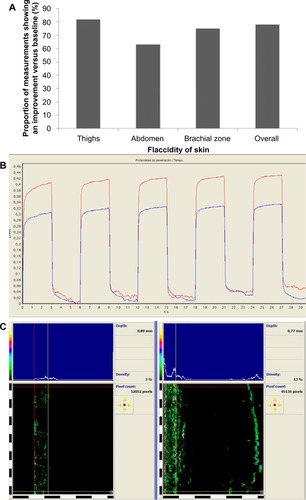
Figure 3 Proportions of skin density and thickness scores that showed an improvement 5 weeks after treatment relative to baseline.
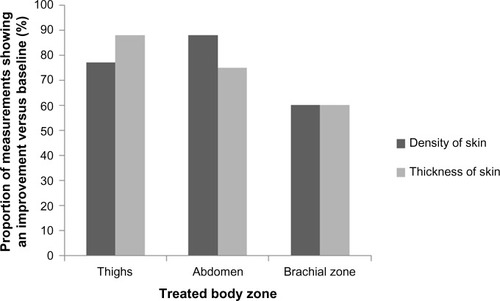
Figure 4 Clinical photographs of the treatment area before and 5 weeks after treatment for (A) thighs and (B) abdomen (right side, treated; left side, untreated).
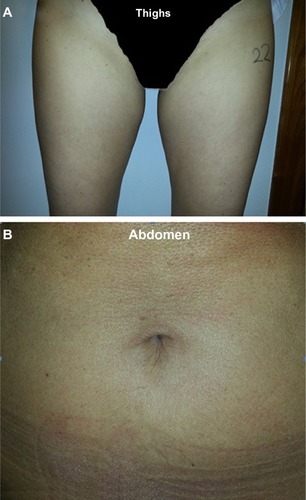
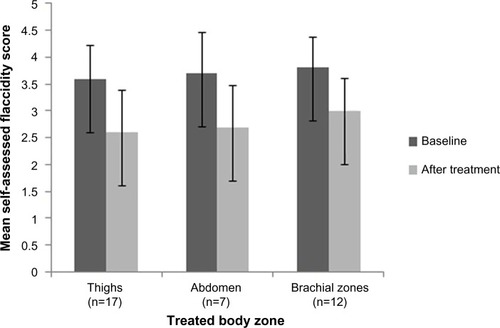
Figure 5 Skin flaccidity score on self-evaluation before and after treatment. Subjects assessed the flaccidity of their skin based on a 6-point scale from 0 (no flaccidity) to 5 (very severe flaccidity). Error bars show standard deviation of the mean.