
Figures & data
Figure 1 Time course of itch intensity for all conditions investigated (VAS ratings 0–10).
Note: VAS is a numerical 10 cm VAS from 0 (no itch) to 10 (maximum unbearable itch).
Abbreviation: VAS, visual analog scale.
Abbreviation: VAS, visual analog scale.
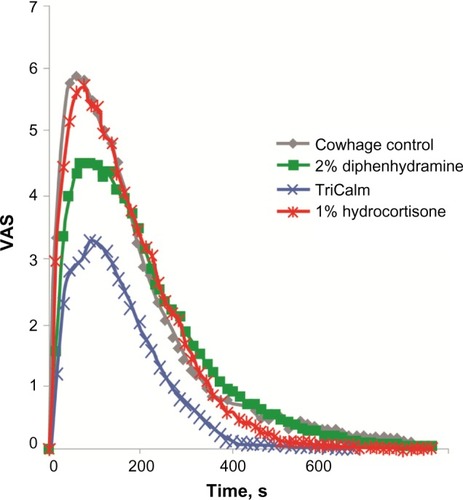
Figure 2 Effect of treatments on (A) peak itch intensity (VAS units), (B) itch duration (seconds), and (C) total itch perceived (AUC).
Note: *Decrease in itch intensity, duration, and AUC was significant in comparison to the control cowhage itch. Results were considered statistically significant for P<0.05.
Abbreviations: AUC, area under the curve; SEM, standard error of the mean; VAS, visual analog scale.
Abbreviations: AUC, area under the curve; SEM, standard error of the mean; VAS, visual analog scale.
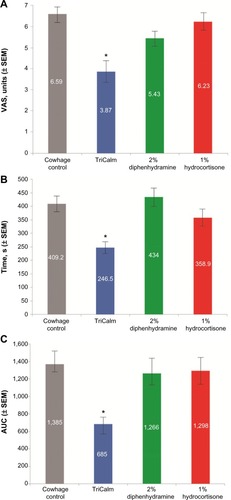
Figure 3 Reduction of (A) peak itch intensity (VAS units), (B) itch duration (seconds), and (C) total itch perceived (AUC) versus control.
Notes:
*P<0.001; #diphenhydramine did not reduce cowhage itch duration. Results were considered statistically significant for P<0.05.
Abbreviations: AUC, area under the curve; SEM, standard error of the mean; VAS, visual analog scale.
Abbreviations: AUC, area under the curve; SEM, standard error of the mean; VAS, visual analog scale.
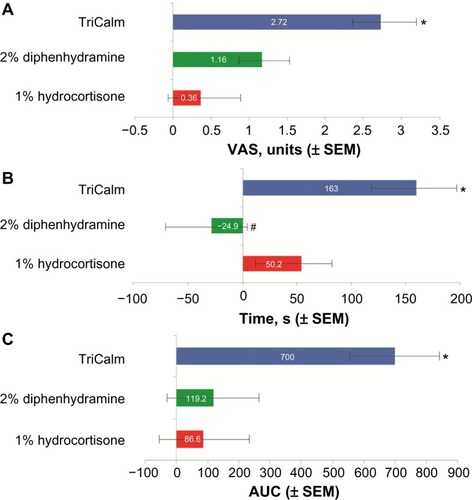
Table 1 Therapeutic efficacy of TriCalm hydrogel in reducing peak itch intensity, itch duration, and overall itch (AUC) in comparison with the other two agents analyzed, in reference to the control itch curve (n=47)Table Footnotea