Figures & data
Table 1 Demographic data
Table 2 Clinical results (source: pollen concentration, SCORAD, subjective parameters of pruritus and sleeplessness)
Figure 1 Pollen concentration (red squares), pruritus (triangle), and subjective assessment of atopic eczema (circles) for sensitized (green lines) and nonsensitized (blue lines) patients.
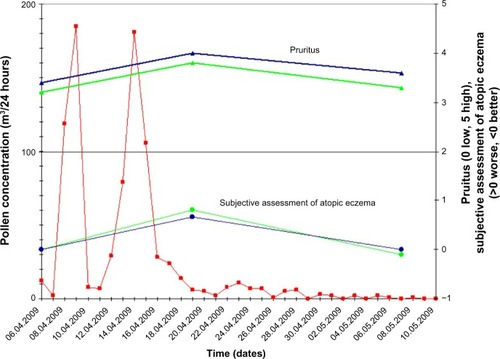
Table 3 Change in the percentage of irritated skin (all exposed areas, face, nonexposed areas) over time
Figure 2 Specific IgE against birch pollen vs SCORAD.
Abbreviations: SCORAD, Severity Score of Atopic Dermatitis; IgE, immunoglobulin E.
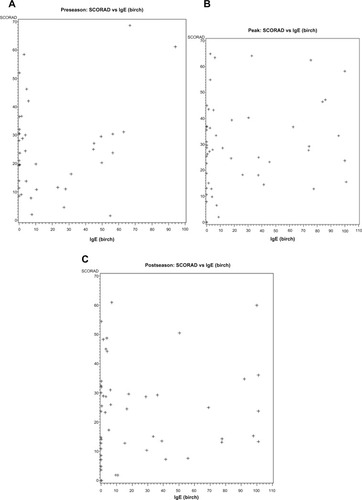
Figure 3 Laser scanning microscopy images of MACS-separated epidermal cells.
Abbreviation: MAC magnetic activated cell sorting.
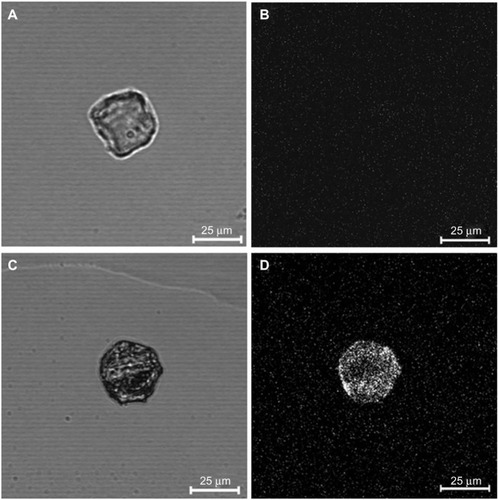
Table 4 Pollen uptake by CD11c+ epidermal cells from normal skin explants with and without barrier defects
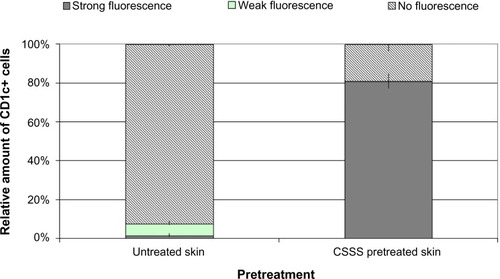
Figure 4 Relative mean values ± standard error for the number of MACS-separated cells with and without fluorescence after pollen allergen application to normal and barrier-disturbed skin.