Figures & data
Figure 1 Illustrations showing dimensions of the crown designs.
Notes: The black line represents the interface between the core and the veneer. The arrows denote the local dimensions of the crowns. M, monolithic; SM0.3, semimonolithic with 0.3 mm buccal veneer; SM0.5, semimonolithic with 0.5 mm buccal veneer; SMW, semimonolithic with 0.5 mm buccal veneer supported by wave design; SMC, semimonolithic with 0.5 mm buccal veneer supported by occlusal cap design.
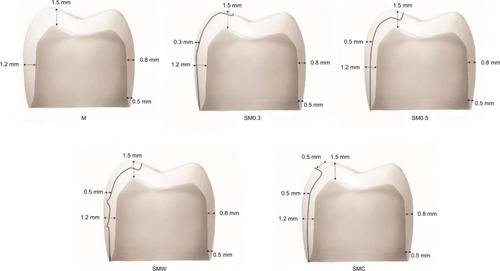
Figure 2 Different crown designs shown: (A) in the CAD software and (B) after milling and sintering.
Notes: M, monolithic; SM0.3, semimonolithic with 0.3 mm buccal veneer; SM0.5, semimonolithic with 0.5 mm buccal veneer; SMW, semimonolithic with 0.5 mm buccal veneer supported by wave design; SMC, semimonolithic with 0.5 mm buccal veneer supported by occlusal cap design.
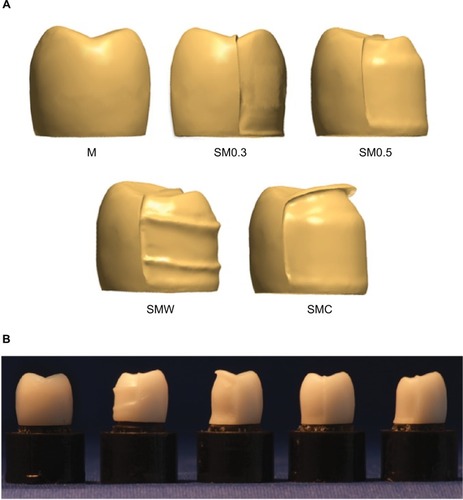
Figure 3 Porcelain build-up step.
Note: The crown with abutment placed on the brass holder, and the specially made knife was used to standardize dimensions of semimonolithic crowns.

Figure 4 Test set-ups used for: (A) cyclic preload and (B) load to fracture.
Note: During the test, the crowns were submerged in water, and a plastic foil was used to spread the load evenly over loaded surfaces.
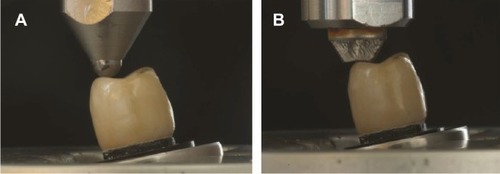
Figure 5 Comparison of mean fracture load (Newton) among the crown designs with two different materials.
Notes: *Mean with the same letters (denoted a, b, and c) did not show any significant difference in fracture load (P>0.05). M, monolithic; SM0.3, semimonolithic with a 0.3 mm buccal veneer; SM0.5, semimonolithic with a 0.5 mm buccal veneer; SMW, semimonolithic with a 0.5 mm buccal veneer supported by wave design; SMC, semimonolithic with a 0.5 mm buccal veneer supported by occlusal cap design.
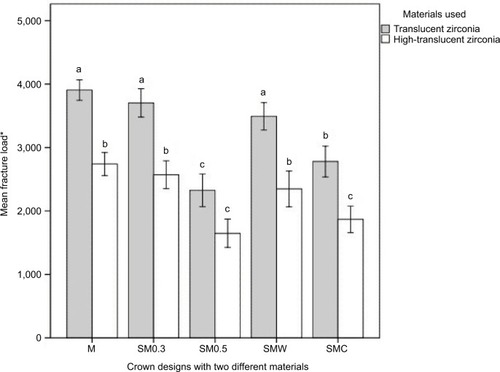
Figure 6 Fracture modes of the crowns: (A) complete fracture in M, SM0.3, and SMC groups and (B) cohesive veneer fracture in SMW and SM0.5 groups.
Notes: M, monolithic; SM0.3, semimonolithic with 0.3 mm buccal veneer; SM0.5, semimonolithic with 0.5 mm buccal veneer; SMW, semimonolithic with 0.5 mm buccal veneer supported by wave design; SMC, semimonolithic with 0.5 mm buccal veneer supported by occlusal cap design.
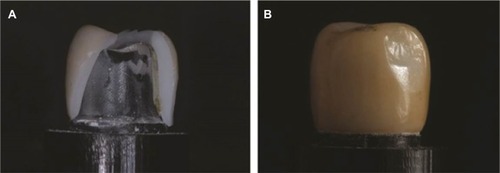
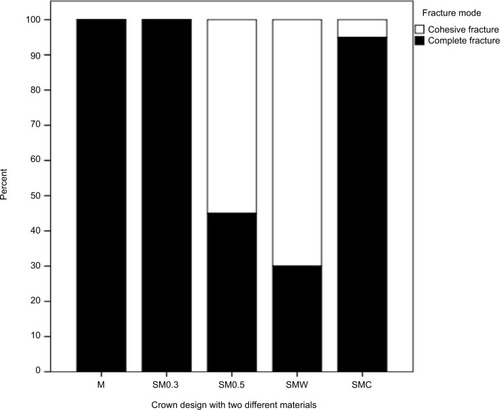
Figure 7 Comparison of fracture mode among the crown designs with two different materials.
Notes: M, monolithic; SM0.3, semimonolithic with a 0.3 mm buccal veneer; SM0.5, semimonolithic with a 0.5 mm buccal veneer; SMW, semimonolithic with a 0.5 mm buccal veneer supported by wave design; SMC, semimonolithic with a 0.5 mm buccal veneer supported by occlusal cap design.