
Figures & data
Figure 1 DTNB oxidation by iodine–thiocyanate complexes: relation between absorbance at 412 nm and oxidant concentration in the reaction medium (mean ± SEM). Inset: relation between absorbance and oxidant solution volume transferred in the reaction medium. The various volumes were made up to 0.5 mL with phosphate buffer and then added to the same reagent volume (2 mL) to obtain a 2.5 mL final volume.
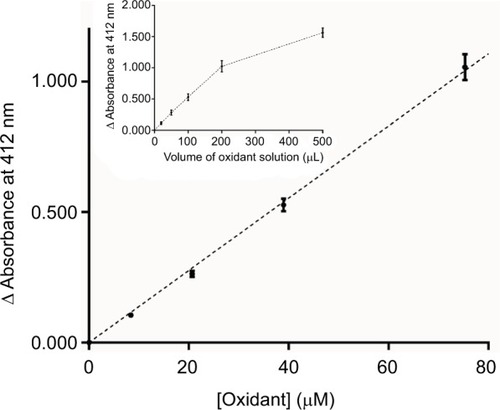
Figure 2 Evaluation of iodine–thiocyanate complexes concentration in solutions stored at 4°C (average of 4 replicates for each of the solutions tested). Oxidant production was assayed by the DTNB method in 47 different oxidant solutions after variable storage times (from 1 day to 132 weeks). Initial concentrations were 1929 ± 46 μM (mean ± SEM, n = 8). Dotted line indicates the value corresponding to the mean − 3 SD of the initial concentrations.
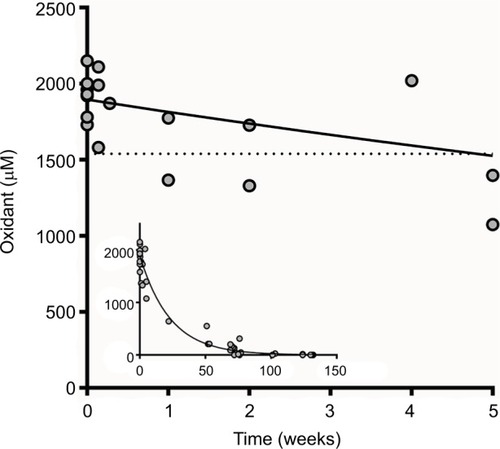
Figure 3 Candida inhibition after a 5-minute incubation at room temperature by various combinations of reagents used to form iodine–thiocyanate complexes. Candida albicans ATCC 10231 survival rate was evaluated by counting colony-forming units (CFUs) after cultivation on Sabouraud agar. Lp was clay-adsorbed inside a teabag. Data are expressed as the percentage of CFUs counted after incubation in 0.1 M phosphate buffer (pH 7.4). Error bars indicate the standard error of the mean (N = 4).
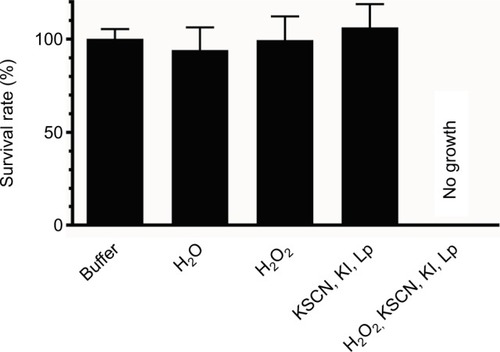
Figure 4 Effect of different concentrations of iodine–thiocyanate complexes on Candida albicans growth (ATCC 10231 and 6 clinical isolates) after a 5-minute incubation at room temperature in the wells of a 96-well polystyrene plate. Yeast growth was then evaluated after addition of Sabouraud broth and incubation at 37°C for 24 hours. Data are expressed as the percentage of turbidity observed in the same conditions after incubation in 0.1 M phosphate buffer (pH 7.4). The different oxidant concentrations were compared with the paired control by ANOVA complemented by a Dunnett’s multiple comparison test (***p < 0.001). Error bars indicate the standard error of the mean (N = 6).
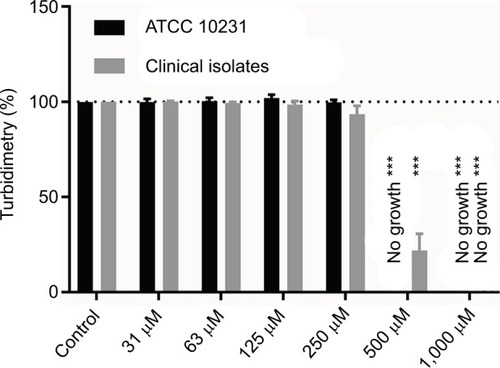
Figure 5 Effect of different concentrations of iodine–thiocyanate complexes on biofilm formation by Candida albicans strains (ATCC 10231 and 6 clinical isolates) after a 5-minute incubation at room temperature in the wells of 96-well polystyrene plate. Biofilm was then evaluated by staining the attached biomass after incubation at 37°C for 24 hours in Sabouraud broth. Data are expressed as the percentage of attached biomass observed in the same conditions after incubation in 0.1 M phosphate buffer (pH 7.4). The different oxidant concentrations were compared with the paired control by ANOVA complemented by a Dunnett’s multiple comparison test (***p < 0.001). Error bars indicate the standard error of the mean (N = 6).
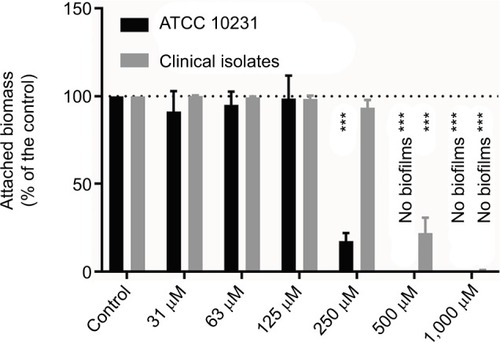
Figure 6 Sabouraud agar plates inoculated by swabbing contaminated acrylic resin pieces and incubated for 48 hours at 37°C. The resin pieces were previously subjected to different processes. (A) Uncontaminated acrylic resin piece processed to attest the sterility of handling. (B) Contaminated (Candida albicans ATCC 10231) acrylic resin piece immersed for 30 minutes in phosphate buffer (0.1 M, pH 7.4) at room temperature. (C) Contaminated (C. albicans ATCC 10231) acrylic resin piece immersed for 30 minutes in the solution of iodine–thiocyanate complexes at room temperature. The data are representative of 4 independent experiments.
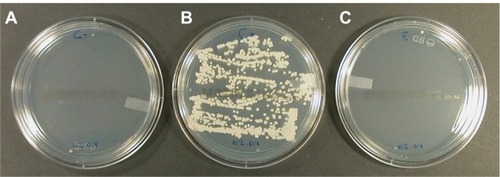
Table 1 Status of Candida contamination for investigated dentures
Table 2 Ex vivo denture decontamination by iodine–thiocyanate complexes
Table 3 Toxicity evaluation of oxidant solution