
Figures & data
Figure 1 The skeletal, dental, and soft tissue landmarks used in the study.
Notes: S, sella turcica, center of the pituitary fossa of the sphenoid bone; N, nasion, the junction of the frontonasal suture at the most posterior point on the curve at the bridge of the nose; Po, porion, the most superior point of the external auditory meatus; Or, orbital, the lowest point on average of the right and left lower borders of the bony orbit; Ba, basion, the most inferior posterior point of occipital bone at the anterior margin of the occipital foramen; Co, condyloid, the most posterior superior point of the condyle; ANS, anterior nasal spine, the tip of the anterior nasal spine; PNS, posterior nasal spine, the tip of posterior nasal spine; A, Point A, the most posterior (deepest) point on the curve of maxilla between the ANS and supradental (dental alveolus); UIA, upper incisor apex; UIE, upper incisor edge; LIE, lower incisor edge; LIA, lower incisor apex; B, Point B, the deepest point on the bony curvature along the anterior border of the symphysis; Pog, pogonion, the most anterior point on the contour of the mandible bony chin; Me, menton, the most inferior point on the symphysis of the mandible; Ar, articulare, intersection between the contour of the external cranial base and the dorsal contour of the condylar head; Go, gonion, the most convex point along the inferior border of the ramus; and Gn, gnathion, the point midway between the Me and Pog.
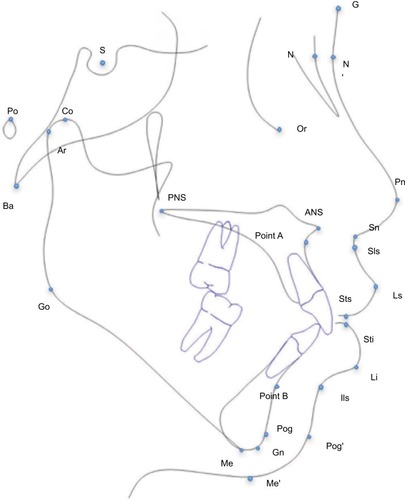
Table 1 Skeletal measurements used in this study
Table 2 Dental measurements used in this study
Table 3 Descriptive data of the sample
Table 4 Distribution of missing teeth in the sample
Table 5 Comparison of skeletal measurements between Groups 1, 2A and 2B using one-way ANOVA and Kruskal–Wallis testTable Footnote*
Table 6 Comparison of dental measurements between Groups 1, 2A, and 2B using one-way ANOVA and Kruskal-Wallis test