Figures & data
Table 1 The Frequency of Complaints in Both Groups
Table 2 The Frequency of Complaints in Both Groups Considering the Number of Complaints by Each Person
Figure 1 Differences in the severity of complaints between the groups.
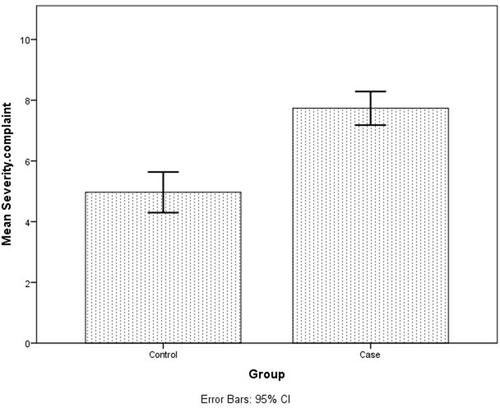
Figure 2 The distribution of the severity of complaints in both groups.
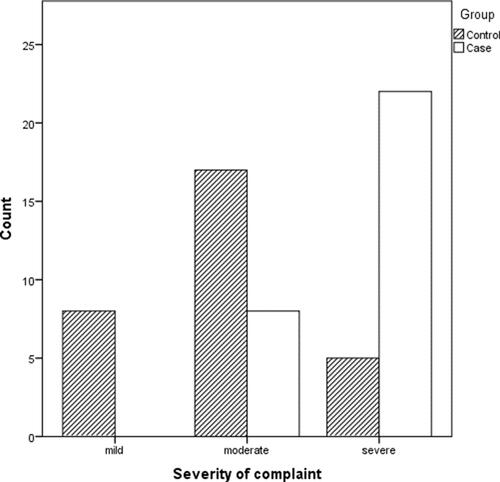
Table 3 The Frequency of Complaint Duration Between Two Groups
Table 4 Comparison of the Type of Stressful Events Among Patients with BMS Syndrome with Control Group
Table 5 The Distribution of Stressful Events in Two Groups
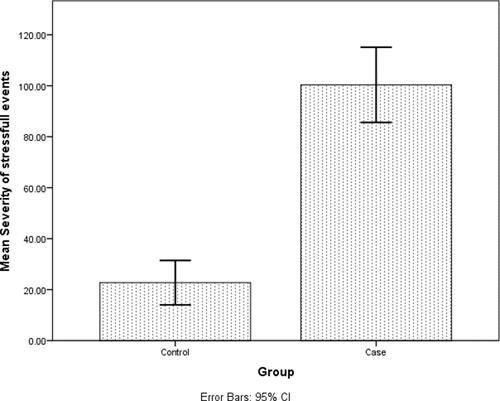
Figure 3 The mean severity of stressful events in two groups.