Figures & data
Figure 1 Shows cosmopost.
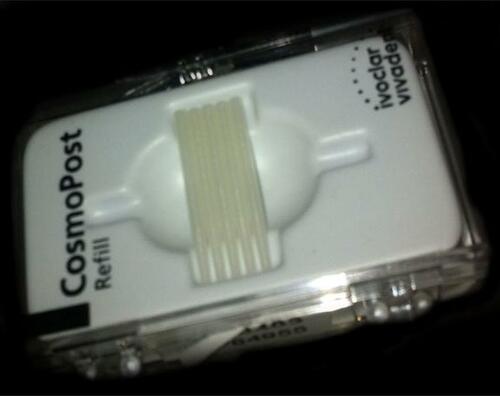
Table 1 Shows Composition, Properties & Manufacturer of Cosmopost
Figure 2 Shows IPS empress cosmo ingot.
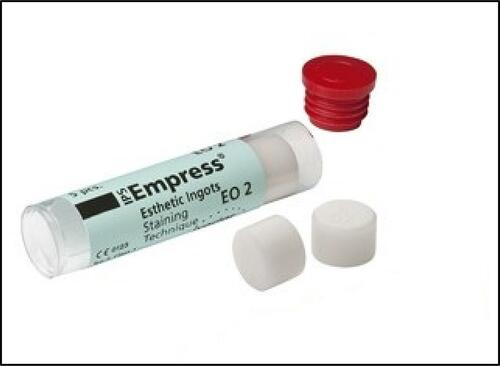
Table 2 Shows Composition, Properties & Manufacturer of IPs Empress
Figure 3 Shows 3M™ filtek composite.

Figure 4 Flow diagram of samples grouping.
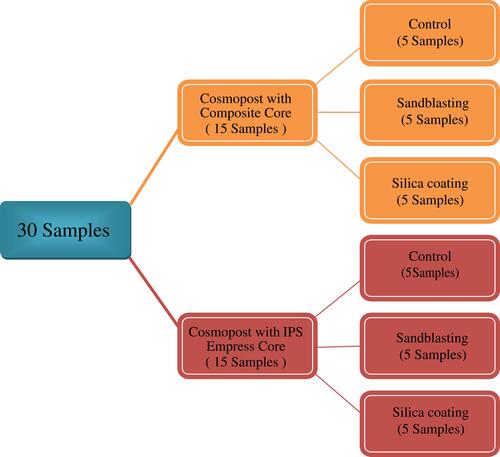
Figure 5 Bar chart representing mean values for comparison between surface roughness of different surface treatments in microns.
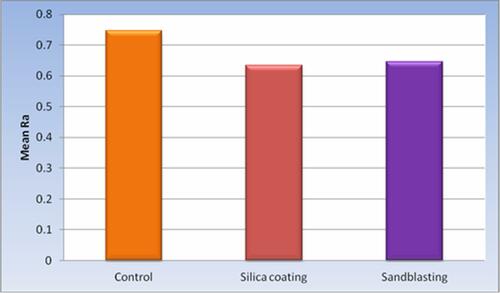
Table 3 Comparison Between Ra Values of Surface Treatments of Composite in Microns
Table 4 Resulted Regression Model Effect on Mean Push-Out Bond Strength of Different Variables in MPa
Figure 6 Row graph displaying mean values for contrast between the bond strength of the two core materials (in MPa).
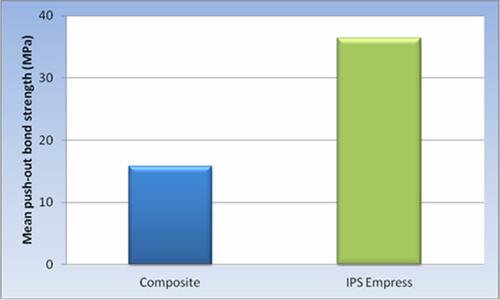
Table 5 Comparison Between Push-Out Bond Strength of Core Materials (in Mpa) Regardless of Surface Treatment
Figure 7 Row graph which shows the mean values for comparing the push-out bond strength of the different surface treatments in MPa.
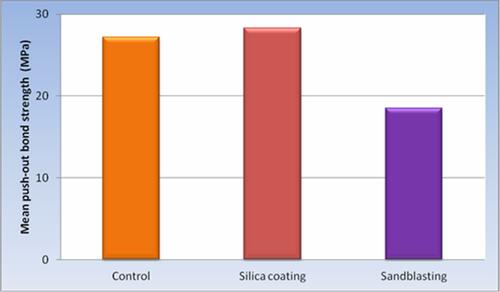
Table 6 Comparison Between Push-Out Bond Strength of Surface Treatments (in Mpa) Regardless of Core Materials
Table 7 Comparison Between Push-Out Bond Strength of Different Variables’ Interactions in MPa
Figure 8 Row graph displaying mean values of the push-out bond strength of a different interaction (in MPa).
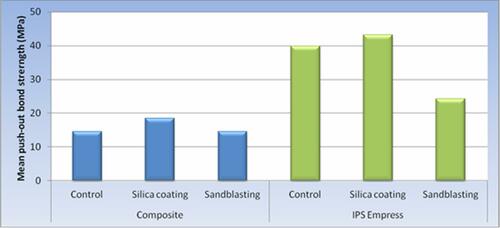
Figure 9 Photomicrograph of untreated zirconia dowel surface (original magnification 300).
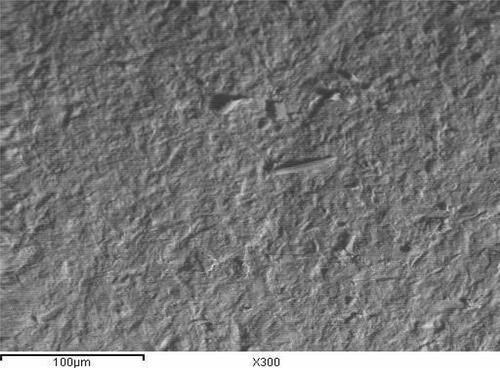
Figure 10 Photomicrograph of sandblasted cosmopost surface.
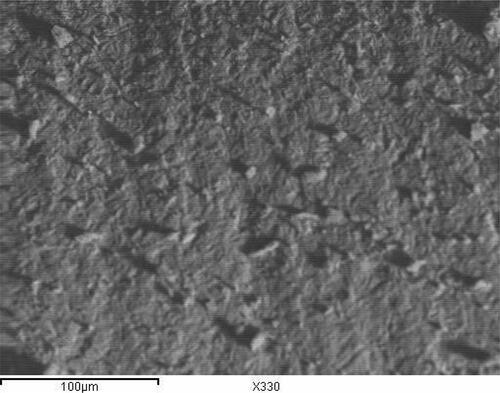
Figure 11 Photomicrograph of silica coated cosmoposts surface.
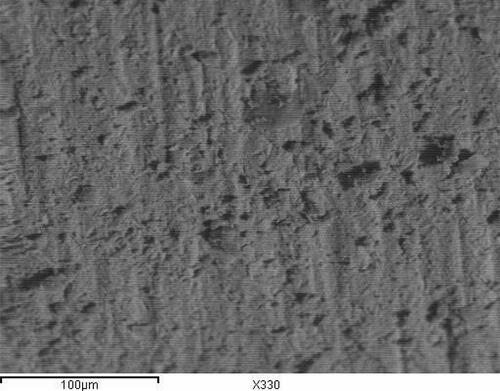
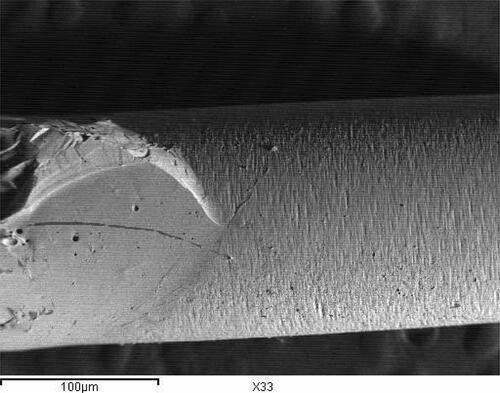
Figure 12 Representative SEM of control group attached to composite core (original magnification 33) demonstrating adhesive type of failure.
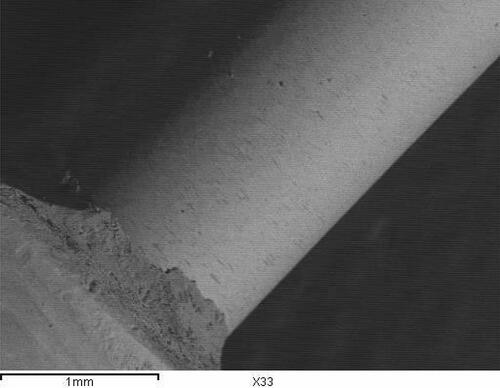
Figure 13 Representative SEM of sandblasting treated group attached to composite core (original magnification 33) demonstrating adhesive type of failure.
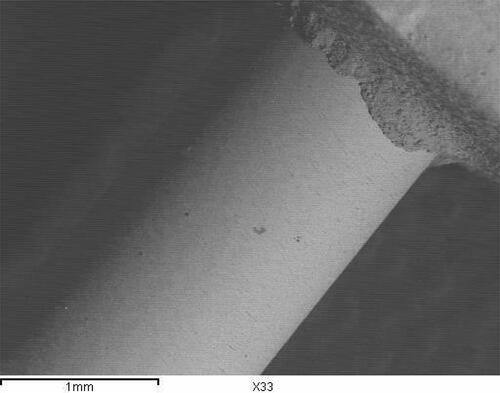
Figure 14 Representative SEM of silica coating treated group attached to composite core (original magnification 33) demonstrating adhesive type of failure.
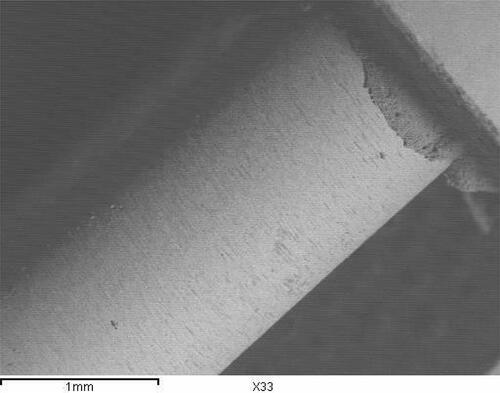
Figure 15 Representative SEM of control group attached to IPS empress core (original magnification 33) demonstrating adhesive/Cohesive type of failure.
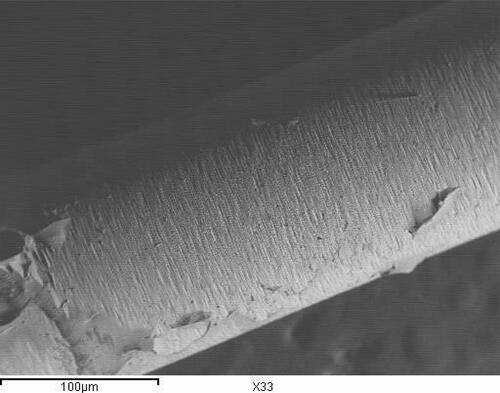
Figure 16 Representative SEM of sandblasting treated group attached to IPS empress core (original magnification 33) demonstrating adhesive/Cohesive type of failure.
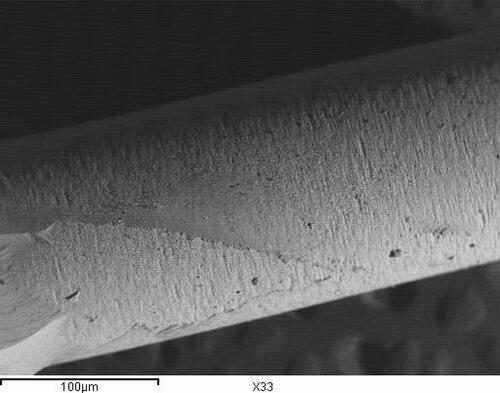
Figure 17 Representative SEM of silica coating treated group attached to IPS empress core (original magnification 33) demonstrating increased cohesive failure and less type of adhesive failure.