Figures & data
Table 1 List of Materials Used in the Study
Table 2 Mean Values of Shear Bond Strength for the Resin-Based Composite Materials Within Each Adhesion Protocol Group
Figure 1 Bar chart representing mean values of shear bond strength for the adhesion protocol groups compared with the cohesive control group. * Statistically significant compared with the cohesive group (P<0.05).
Abbreviations: SBS, shear bond strength; FOBF, Filtek One Bulk Fill; TNCBF, Tetric-N Ceram Bulk Fill; Z350XT, Filtek Z350 XT; NT, no treatment; OB, OptiBond Solo Plus total-etch system; CFSE, Clear Fil SE Bond 2 self-etch system; SBU-TE, single bond universal in total-etch mode; SBU-SE, single bond universal in total-etch mode.
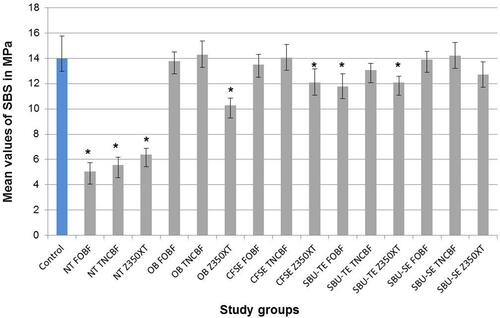
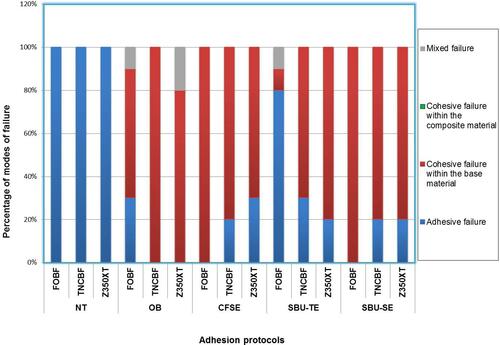
Figure 2 Stacked bar chart that displays the distribution of modes of failure in adhesion protocol groups.
Abbreviations: FOBF, Filtek One Bulk Fill; TNCBF, Tetric-N Ceram Bulk Fill; Z350XT, Filtek Z350 XT; NT, no treatment; OB, OptiBond Solo Plus total-etch system; CFSE, Clear Fil SE Bond 2 self-etch system; SBU-TE, single bond universal in total-etch mode; SBU-SE, single bond universal in total-etch mode.