Figures & data

Figure 1 STORBE chart for patient flow and patient’s selection.
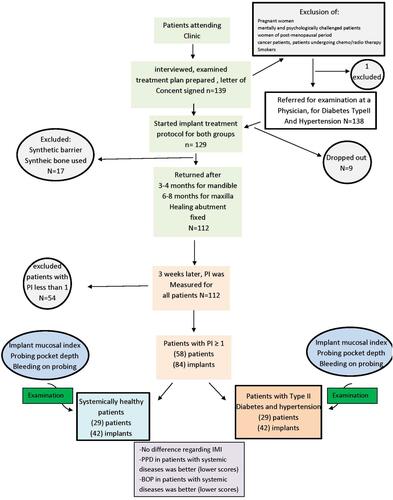
Table 1 Descriptive Numbers of Patients and Implants Characteristics That Participated in the Research
Table 2 Descriptive Statistics of Plaque Index, Implant Mucosal Index, Probing Pocket Depth and Bleeding on Probing for Two Groups When Each Implant Was Considered a Sample
Table 3 Descriptive Statistics of Plaque Index, Implant Mucosal Index, Probing Pocket Depth and Bleeding on Probing for the Two Groups When Patients are Considered as Samples
Figure 2 Probing around the healing abutment to measure IMI and PI using a CPITN periodontal probe.
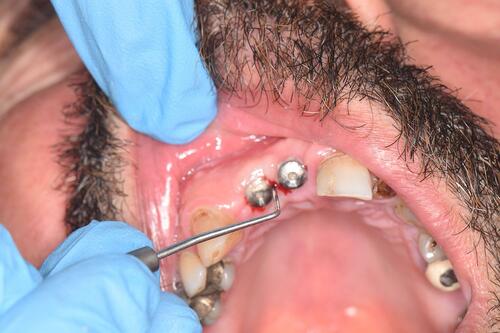
Figure 3 Measuring the pocket depth around healing abutment.
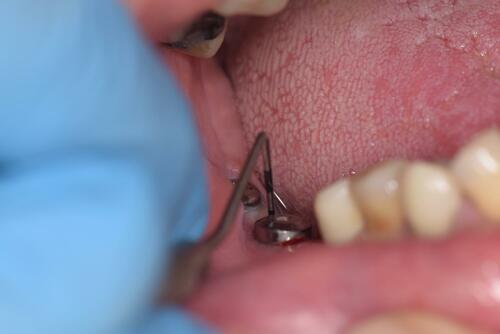
Figure 4 The PI of group A and group B.
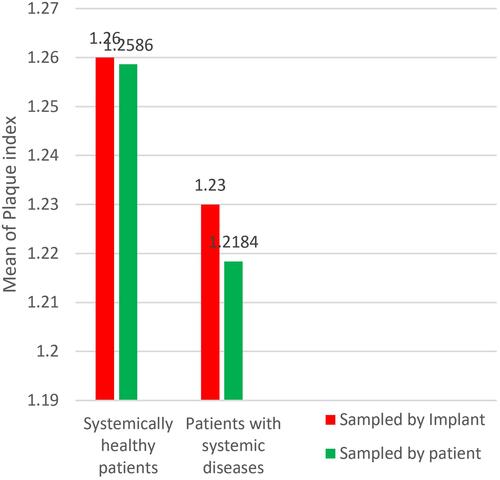
Table 4 Mann–Whitney Test for Means of Plaque Index (PI), Implant Mucosal Index (IMI) and Probing Pocket Depth (PPD) Comparison Between Group A and Group B (Each Sample Represents an Implant)
Table 5 Mann–Whitney Test for Means of Plaque Index (PI), Implant Mucosal Index (IMI) and Probing Pocket Depth (PPD) Comparison Between Group A and Group B (Each Sample Represents a Patient)
Figure 5 Means of IMI of group A and group B.
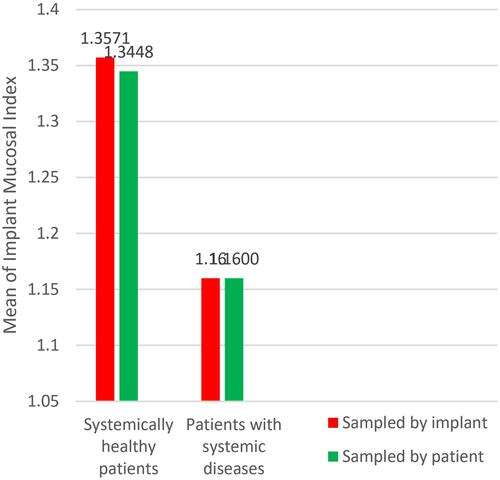
Figure 6 Means of probing pocket depth of group A and group B.
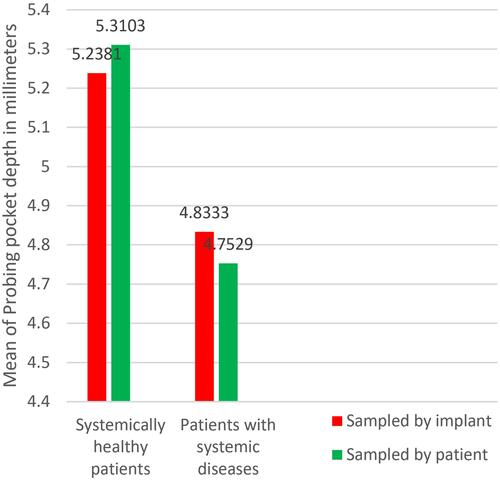
Table 6 Chi-Square Test for Bleeding on Probing Means of the Two Groups A and B (Each Sample Represents an Implant)
Table 7 Chi-Square Test for Bleeding on Probing Means of the Two Groups A and B (Each Sample Represents a Patient)
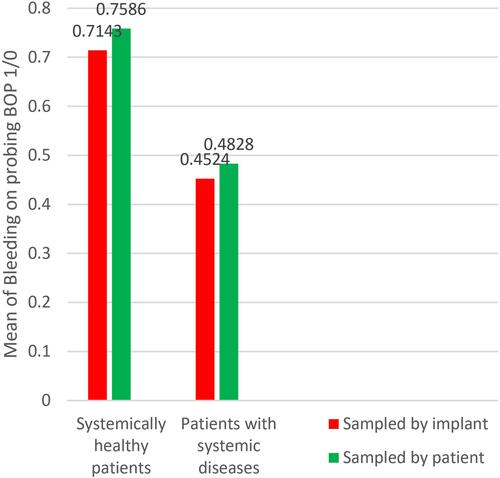
Figure 7 Means of BOP of groups A and B.