
Figures & data
Table 1 Sample Characteristics, Ankylosing Spondylitis Activity, and Functional Disability
Table 2 Prevalence of TMD Diagnoses According to the Axis I of RDC/TMD
Figure 1 Diagnostic distributions of the cases relative to TMJ Group I, II, and III. Group I – Muscle Diagnosis, Group II – Disc displacements on the (right and left) joint, and Group III – Other joint conditions (Arthralgia, osteoarthritis, and osteoarthrosis).
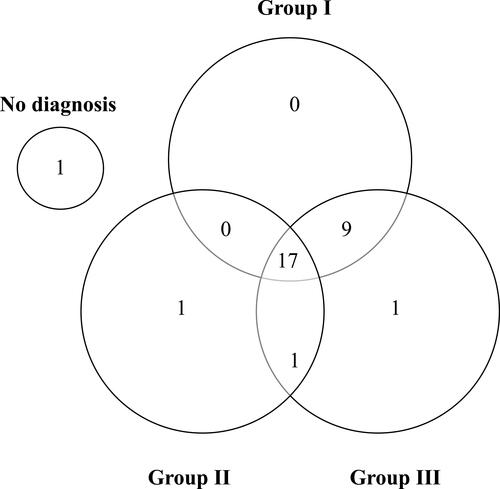
Table 3 Prevalence of Pain-Related Intensity and Disability, Psychosocial Disability, and Mandibular Functioning Limitation According to Axis II of RDC/TMD
Table 4 Prevalence of Self-Reported TMD and Sleep and Awake Bruxism/Tightness According to Axis II of RDC/TMD