Figures & data
Figure 1 A specimen tooth embedded in autopolymerizing acrylic cylinder with the help of the vertical positioner.
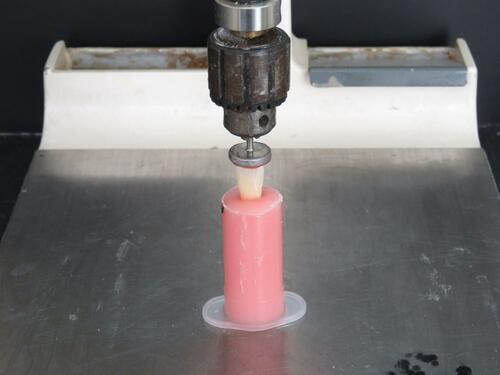
Figure 2 A specimen which is fixed in the housing of the special specimen holder, during fracture testing.
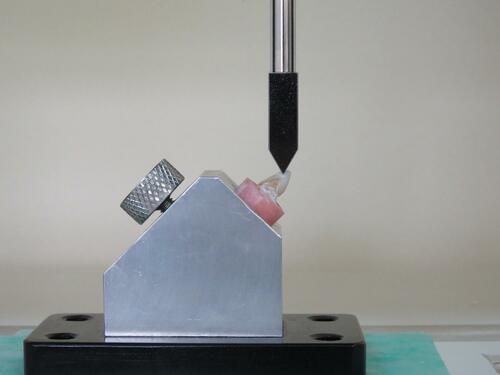
Table 1 Descriptive Statistics of the Test Groups
Table 2 The Difference Between the Mean Fracture Strengths of the Groups Was Statistically Significant According to One-Way ANOVA (P < 0.05)
Table 3 Multiple Comparisons with Bonferroni Test
Figure 3 Bar graph presentation of the descriptive statistics.
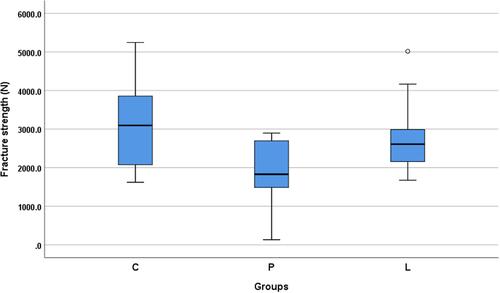
Table 4 Failure Modes and Their Distribution to the Groups
Table 5 Statistics of Failure Modes According to Pearson Chi Square
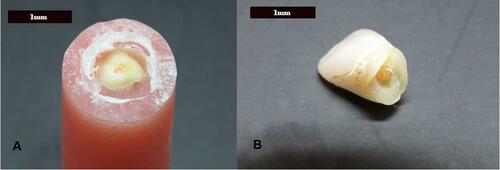
Figure 4 Adhesive failure between the tooth and ceramic surfaces. No damage was detected in the tooth (A) or the porcelain (B).
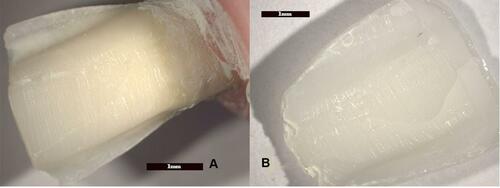
Figure 5 Cohesive failure in which the tooth structure is not damaged (A), only the porcelain is fractured (B).
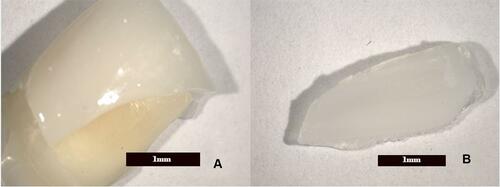
Figure 6 Cohesive failure in both the tooth (A) and the porcelain (B).
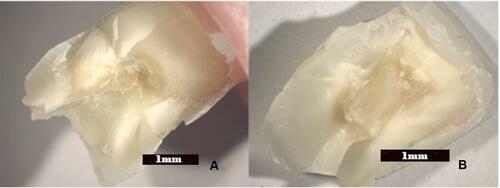
Figure 7 Cohesive failure in which the tooth structure is fractured (A) while the porcelain was not damaged (B).
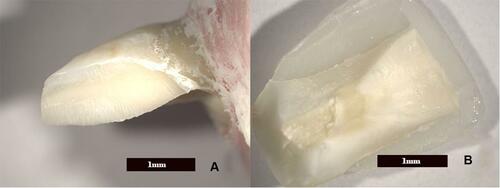
Figure 8 Cervical fracture as cohesive failure mode. Fractured root fragment of the specimen tooth (A) and coronal region with intact PLV (B).