Figures & data
Table 1 Groups Division
Table 2 Description of Materials According to Manufacturer and Composition
Table 3 Mean (Standard Deviation) of Knoop Microhardness as a Function of Exposure Times for the Tested Groups
Table 4 Means (Standard Deviation) of Surface Roughness (Ra) According to Exposure Times for the Tested Groups
Table 5 Means (Standard Deviation) of Mass Variation According to Exposure Times for the Tested Groups
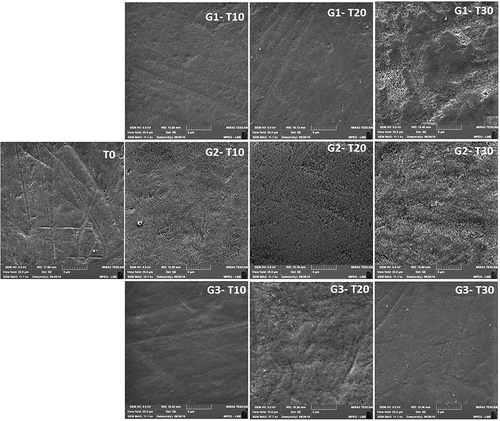
Figure 1 Representative images of treated enamel surfaces according to groups.