
Figures & data
Table 1 Average of Different Patients’ Anthropometric Measurements, Body Composition and Age. For All Patients and for Each BMI Group with P values for Differences Between Group Means
Figure 1 Percentages of excellent and very good scores for different aspects of patient satisfaction for each BMI group.
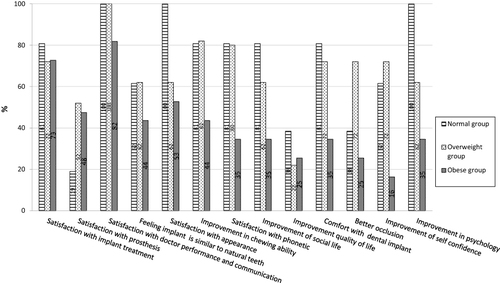
Table 2 Average of Different Patients’ Satisfaction Aspects for All Patients and for Each BMI Group with P value for Differences Between Group Means
Table 3 Correlation Values Showing the Relation Between Patient Satisfactions Aspects and Different Patient Anthropometric Measurements, Body Composition and Age