Figures & data
Table 1 The Dental Pulp Treatment in Animals
Figure 1 An illustration of the dental pulp inflammation procedure and the treatment procedure.
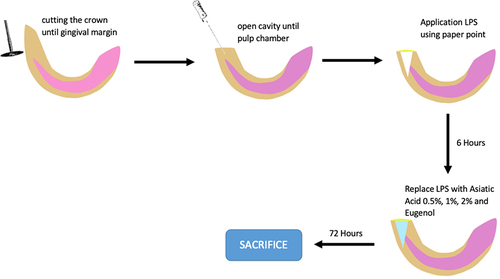
Figure 2 The result of pain assessment using the RGS scale. The differences between parameters were analysed using Kruskal Wallis and the post hoc test. *p<0.05 and ns = not significant (not shown). The replication of the group was 5.
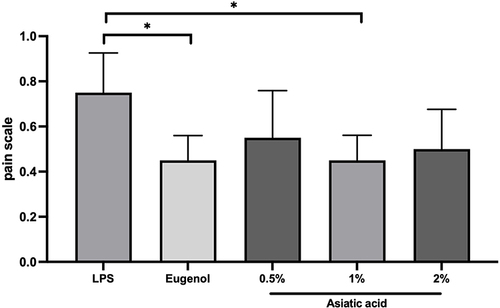
Figure 3 Inflammation reaction based on the intensity of inflammatory cells. Score 1 (0–20 cells), score 2 (21–40 cells), score 3 (41–80 cells). The replication of the group was 5.
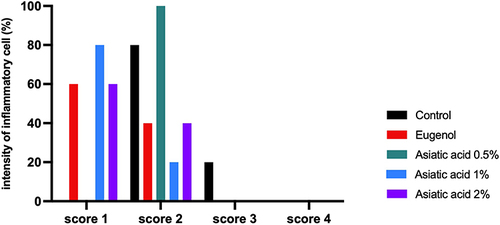
Figure 4 The histopathology of dental pulp to assess the inflammation after treatment with Asiatic acid. The blue box indicated the coronal-pulp chamber and pointed as an area of observation H&E staining. Yellow arrows represent vascular leakage, characterised by erythrocyte discharge from blood vessels, while black arrows represent inflammatory cells. The replication of the group was 3.
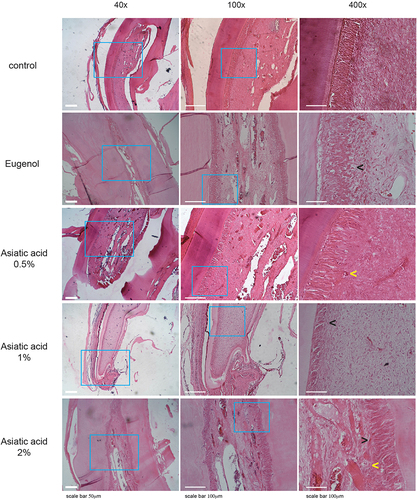
Figure 5 ELISA examination results from pulp tissue that had been treated for 72 hours. Examination of MDA (A) and SOD (B) levels. The differences between parameters were analysed using One Way ANOVA and the post hoc test. **p<0.001; ***p<0.0001; ****p<0.0000 and ns = not significant (not shown). The replication of the group was 5.
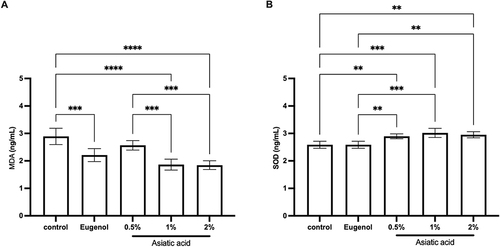
Figure 6 ELISA examination for TNF-α levels from pulp tissue that had been treated for 72 hours. The differences between parameters were analysed using One Way ANOVA and the post hoc test. **p<0.001; ***p<0.0001; ****p<0.0000 and ns = not significant (not shown). The replication of the group was 5.
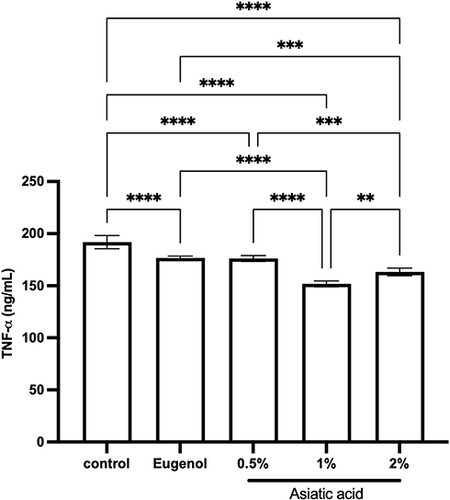
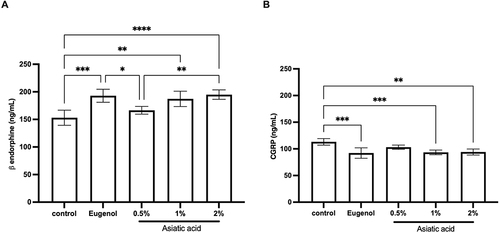
Figure 7 ELISA examination of beta-endorphins (A) and CGRP (B) from pulp tissue that had been treated for 72 hours. The differences between parameters were analysed using One Way ANOVA and the post hoc test. * p<0.05; ** p<0.01; ***p<0.001; ****p<0.0001 and ns = not significant (not shown). The replication of each group was 5.