
Figures & data
Figure 1 Pre-operative photograph of gingival enlargement.
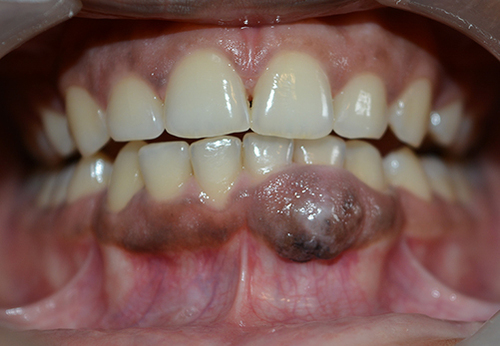
Figure 2 OPG and CBCT images showing minimal bone loss in the labial plate beneath the gingival overgrowth (A–D).
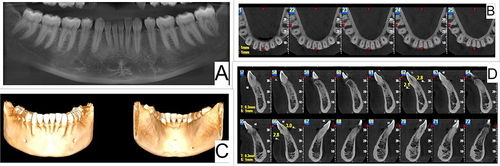
Figure 3 (A) Immediate Post-operative photograph after surgical excision of the lesion. (B) Collagen sponge dressing sutured over the surgical excision site. (C) One-month post-operative photograph showing a well healed surgical site.
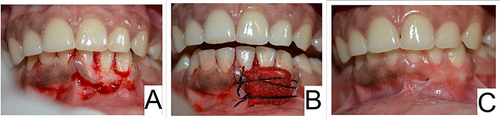
Figure 4 H&E-stained section (100x) which shows the proliferation of nevus cells, with junctional separation and differentiation of lesional cells. Yellow arrow points to type A cells and blue arrow points to type B cells.
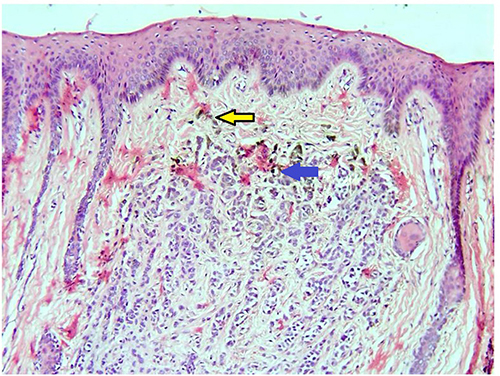
Figure 5 (A) Preoperative and (B) one-year post-operative photograph, showing a focal area of hyper-pigmentation.
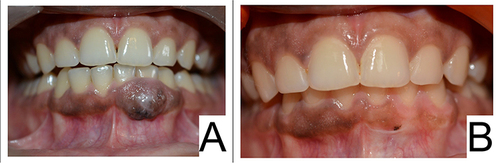
Table 1 Distribution of Incidence Percentage of Oral nevusCitation11