
Figures & data
Figure 1 The symphysis section and the studied measurements. a-Cortical thickness; P1, the crest of the ridge; P6, the base of the mandible; P2, the upper buccal; P3, the upper lingual; P4, the lower buccal; and P5, the lower lingual. b-HL, the total height; W1, width of the upper third; and W2, width of the lower third. c-densities of the bones were measured at positions P1, P6, P7, and P8.
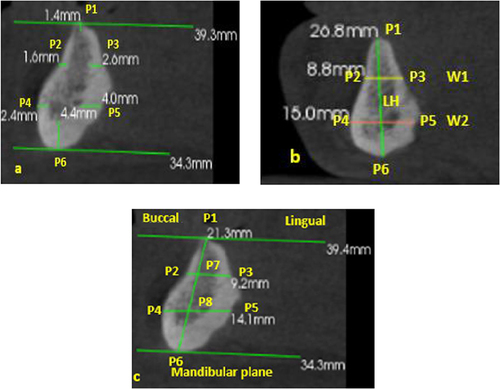
Table 1 Comparison of Bone Dimensions and Density of the Mandible Symphysis Between Males (n=45) and Females (n=45)
Table 2 Comparison of Cortical Thickness for All Subjects (Males and Females)
Table 3 Correlation Between Bone Height (HL) and Both of Bone Density and Width at the Symphyseal Region (n=90)
Table 4 The Gender Distribution of Cawood and Howell Classifications of the Symphysis
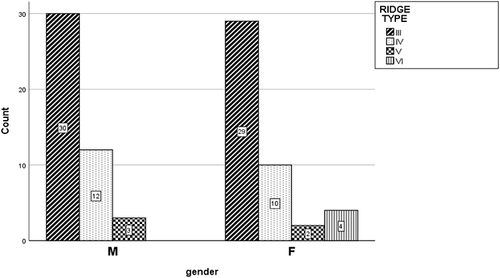
Figure 2 According to gender, the distribution of Cawood and Howell classes (45 males and 45 females). Due to the criteria of our study, no patients from classes I or II were allowed to take part.
Data Sharing Statement
The data used to support the findings of this study are available from the corresponding author upon request.