
Figures & data
Figure 1 Flowchart of the study design for CHD and periodontitis patients.
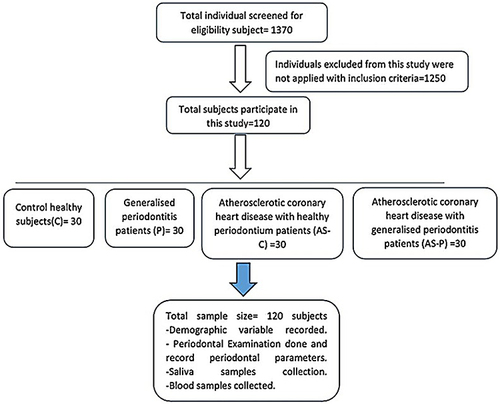
Table 1 Demographic Characteristics, Clinical Periodontal Parameters, 1L-18 and Gasdermin D of the Control (C), Generalized Periodontitis (P), CHD and Clinically Healthy Periodontium (as-C); and CHD with Generalized Periodontitis (as-P) Groups. Data are Expressed as the Mean ± SD
Figure 2 The mean value of salivary IL-18 levels in the study groups; **significant p ≤ 0.01.
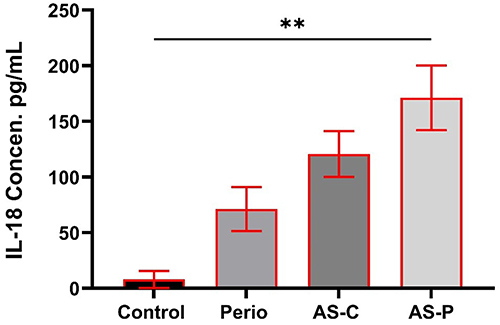
Figure 3 The mean value of salivary gasdermin D levels in the study groups; **significant p ≤ 0.01.
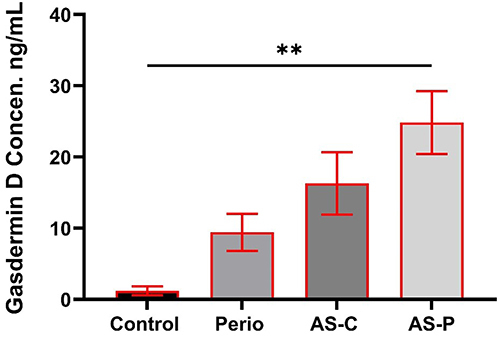
Table 2 AIM2 G/T (rs2793845) Genotype Distribution, Allele Frequencies and Hardy-Weinberg Equilibrium Between Control Group and Periodontitis, Atherosclerotic with Health Periodontium and Atherosclerotic with Periodontitis Patients’ Groups
Table 3 Pycard C/T (rs8056505) Genotype Distribution, Allele Frequencies and Hardy-Weinberg Equilibrium Between Control Group and Periodontitis, Atherosclerotic with Health Periodontium and Atherosclerotic with Periodontitis Patients’ Groups
Figure 4 Genotype Distribution of AIM2 G/T gene in the study groups.
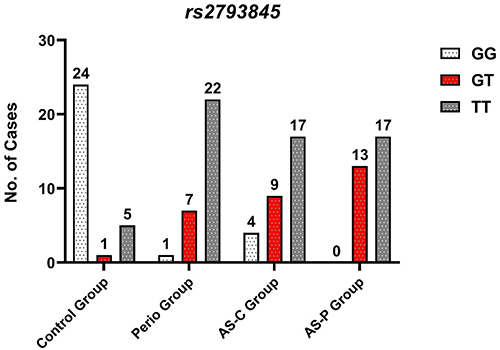
Figure 5 Genotype Distribution of Pycard C/T gene in the study groups.
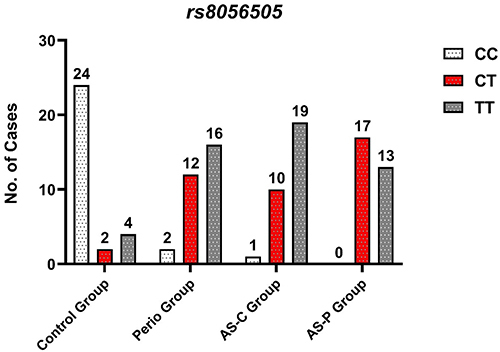
Table 4 The Association Between Mean Values of Age, Gender, BMI, the Clinical Parameters, IL-18, GSDMD and SNPs of AIM2 G/T (rs2793845), Pycard C/T (r rs8056505) of Patients Groups