
Figures & data
Figure 1 Patient disposition for the subgroup of patients with IDA and GI disorders.
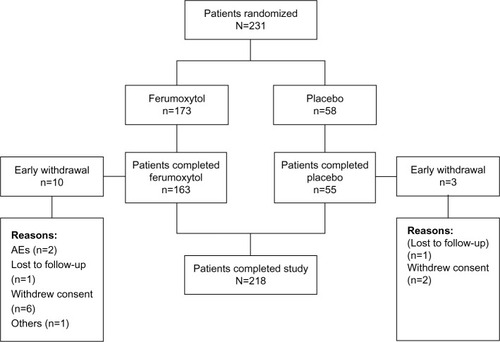
Table 1 Baseline characteristics of the subgroup of patients with IDA and GI disorders (intent-to-treat population)
Figure 2 Mean Hgb values (g/l) from baseline to Week 5 in patients with IDA and GI disorders (intent-to-treat population).
Abbreviations: Hgb, hemoglobin; IDA, iron deficiency anemia; GI, gastrointestinal.
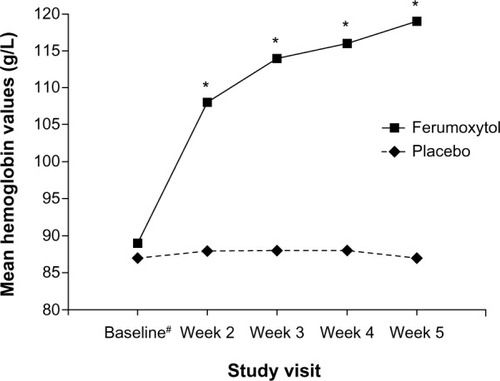
Table 2 Efficacy end points in the subgroup of patients with IDA and GI disorders (intent-to-treat population)
Figure 3 Mean TSAT values from baseline to Week 5 in patients with IDA and GI disorders (intent-to-treat population).
Abbreviations: IDA, iron deficiency anemia; GI, gastrointestinal; TSAT, transferrin saturation.
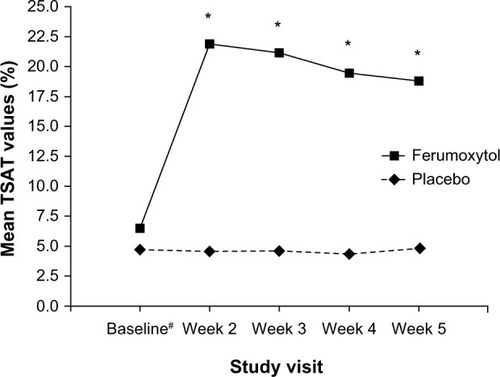
Figure 4 SF-36 domain scores at baseline in patients with IDA and GI disorders (intent-to-treat population).
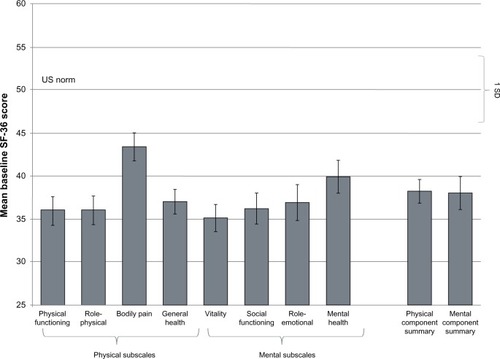
Figure 5 Patient-reported outcomes at baseline and Week 5 in patients with IDA and GI disorders (intent-to-treat population).
Abbreviations: IDA, iron deficiency anemia; GI, gastrointestinal.
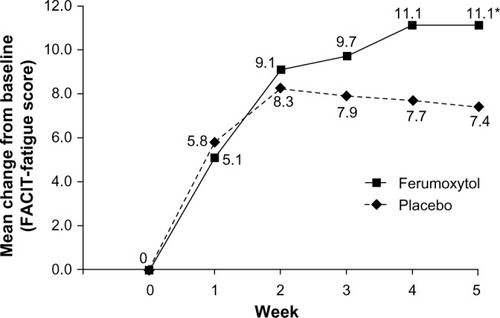
Figure 6 Patient-reported outcomes at baseline and Week 5 in patients with IDA and GI disorders (intent-to-treat population).
Abbreviations: IDA, iron deficiency anemia; GI, gastrointestinal.
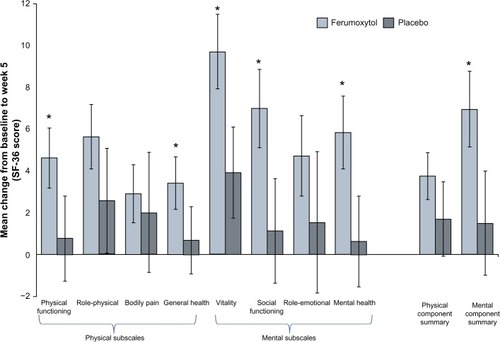
Figure 7 Patient-reported outcomes at baseline, Week 3, and Week 5 in patients with IDA and GI disorders (intent-to-treat population).
Abbreviations: IDA, iron deficiency anemia; GI, gastrointestinal.
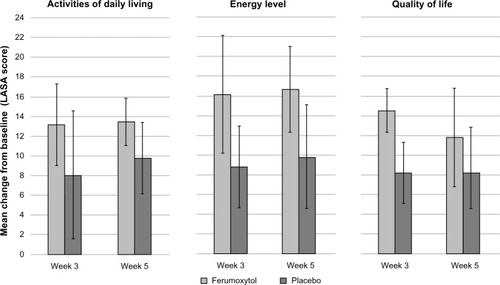
Table 3 Summary of TEAEs in patients with IDA and GI disorders (safety population)