Figures & data
Figure 1 Immunohistochemical score of TGR5 in EAC.
Abbreviations: EAC, esophageal adenocarcinoma; TGR5, the G-protein coupled bile acid receptor.
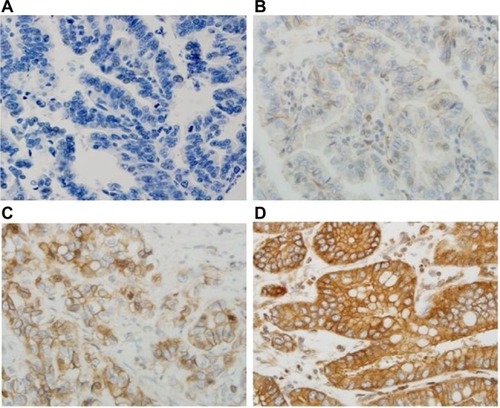
Figure 2 High expression of TGR5 in various histologic subtypes assessed via immunohistochemical studies.
Notes: (A) TGR5 positive cells (score 2+ in most cells) predominately distributed in the basal layer of normal esophageal squamous epithelium; (B) TGR5 strongly positive cells evenly distributed in the glands of columnar cell metaplasia; (C) TGR5 strongly positive cells evenly distributed in the glands of Barrett’s esophagus; (D) TGR5 strongly positive cells evenly distributed in low-grade dysplasia glands; (E) TGR5 strongly positive cells evenly distributed in high-grade dysplasia glands; (F) TGR5 strongly positive cells evenly distributed in EAC glands. Magnification (A) 200× and (B–F) 400×.
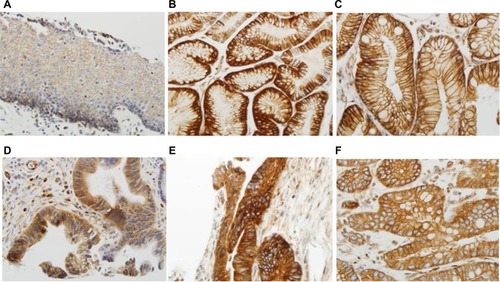
Table 1 Rates of TGR5 high expression in EAC and precancerous lesions
Table 2 Comparison of TGR5 high-expression rates between various esophageal lesions
Figure 3 Association between TGR5 high expression and overall survival of esophageal adenocarcinoma patients.
Abbreviations: EAC, esophageal adenocarcinoma; TGR5, the G-protein coupled bile acid receptor.
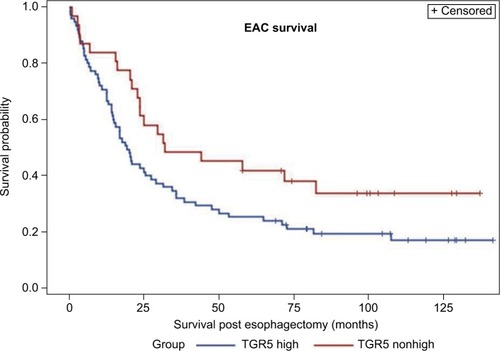
Table 3 Examination of the relationship between TGR5 high expression and clinicopathologic characteristics in esophageal adenocarcinoma
Table 4 Overall association between high TGR5 expression and high VDR expression in esophageal adenocarcinoma and precancerous lesions
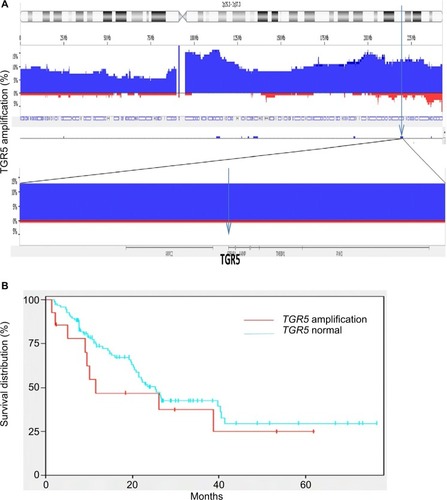
Figure 4 TGR5 amplification and overall survival.
Notes: (A) Frequency histogram indicates amplification of the TGR5 locus at chromosome 2q35 in 116 esophageal adenocarcinoma samples, using high density copy number DNA microarrays. This locus is amplified in 14/116 (12.7%) cases in this patient cohort. (B) There is no significant association between TGR5 amplification and overall survival (p=0.33).