
Figures & data
Figure 1 Chemical structure of eluxadoline.
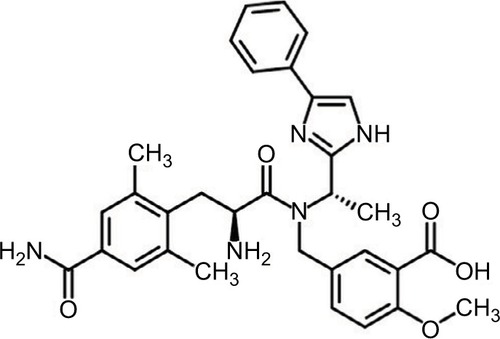
Figure 2 Flowchart of studies.
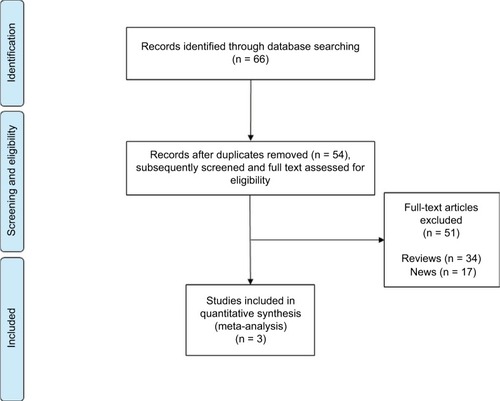
Table 1 Randomized controlled trials of eluxadoline for IBS-D
Figure 3 Forest plots of efficacy outcomes.
Note: Eluxadoline vs placebo at 12 and 26 weeks.
Abbreviations: IBS, irritable bowel syndrome; IV, inverse variance; OR, odds ratio; QoL, quality of life; SE, standard error; SMD, standardized mean difference.
Abbreviations: IBS, irritable bowel syndrome; IV, inverse variance; OR, odds ratio; QoL, quality of life; SE, standard error; SMD, standardized mean difference.
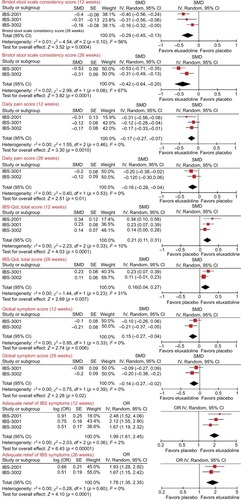
Figure 4 Risk of bias graph: review authors’ judgments about each risk of bias item presented as percentages across all included studies.
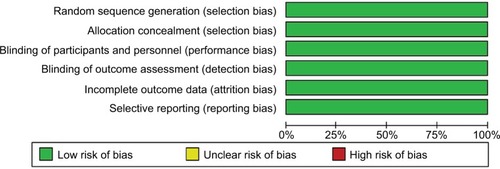
Table 2 Meta-analysis of efficacy outcomes and main adverse events
Figure 5 Forest plots of adverse events.
Note: Eluxadoline 100 mg vs placebo.
Abbreviations: M-H, Mantel–Haenszel; OR, odds ratio.
Abbreviations: M-H, Mantel–Haenszel; OR, odds ratio.
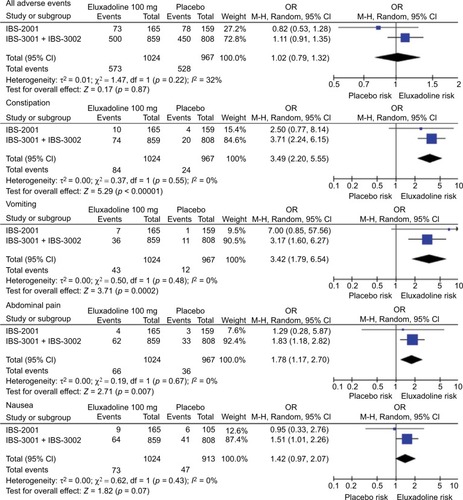
Table 3 Frequency of adverse events for IBS-2001, IBS-3001, and IBS-3002