Figures & data
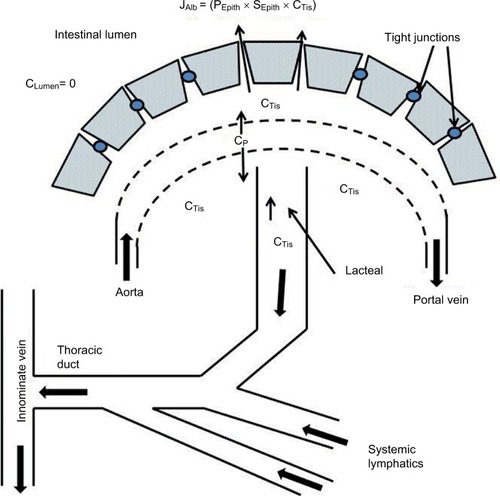
Figure 1 Schematic diagram of normal intestinal mucosa.
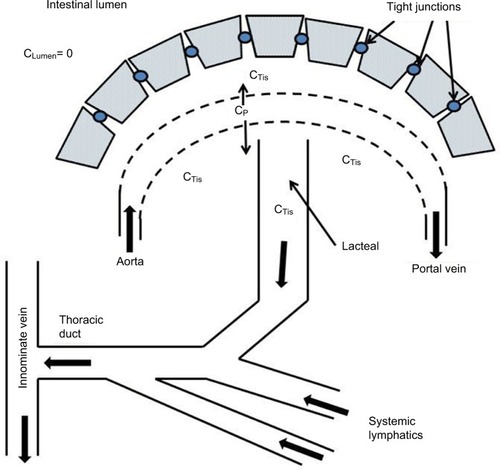
Figure 2 The predicted relationship between the increase in GI albumin clearance and the resulting steady-state serum albumin (serum albumin/normal albumin) in a PLE subject with normal renal and hepatic functions.
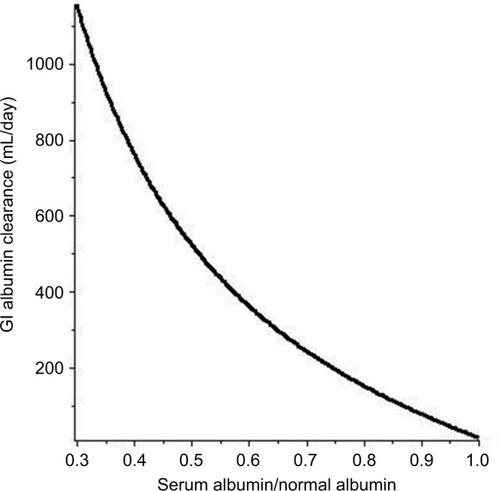
Figure 3 Schematic diagram illustrating the pathophysiology for the PLE produced by increased lymphatic pressure resulting from increased venous pressure (PVein).
Abbreviation: PLE, protein losing enteropathy.
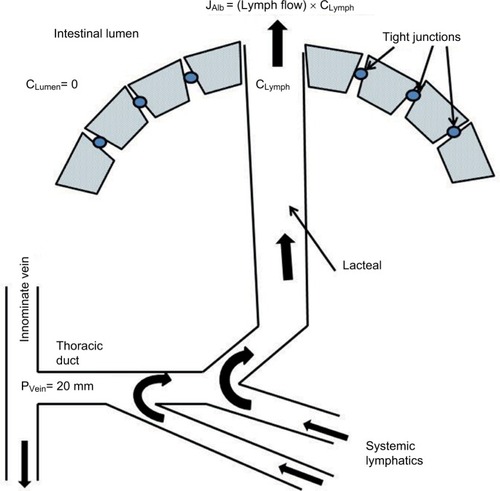
Figure 4 Fecal α-antitrypsin clearance in various disease states.
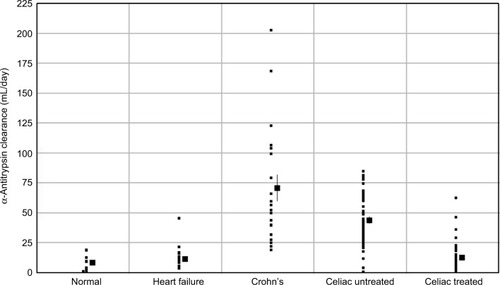
Figure 5 Schematic diagram of the PLE occurring in diseases with mucosal erosions.
Abbreviation: PLE, protein losing enteropathy.
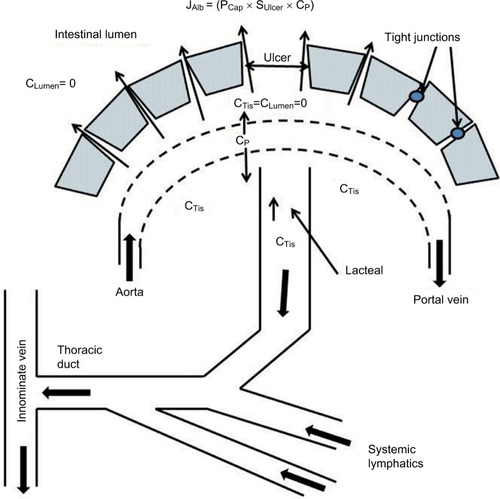
Figure 6 The lactulose/mannitol permeability ratio in Crohn’s and celiac diseases.
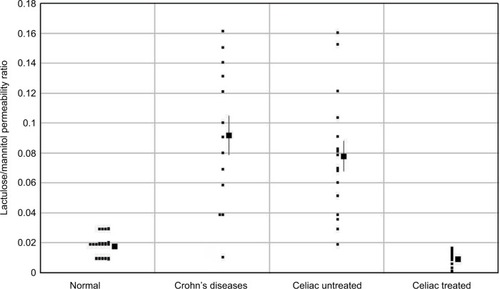
Figure 7 Schematic diagram of the PLE occurring in diseases without mucosal erosions.
Abbreviation: PLE, protein losing enteropathy.