Figures & data
Figure 1 Trichrome staining for collagen in human biliary atresia. Trichrome staining was done as described in the Materials and methods section. A) Thick bands of collagen septa (green) separating nodular liver tissue. B) Trichrome staining of a healthy control liver (original magnification ×10).
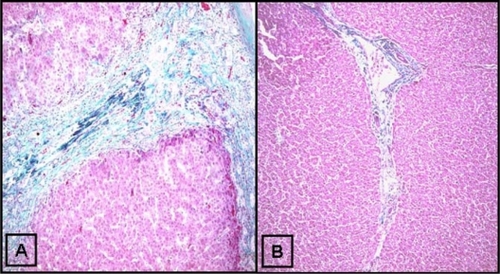
Figure 2 Immunohistochemical localization of TGFβ1 protein in human BA. Specific staining of TGFβ1 protein is represented by brown coloration. A) The expression of TGFβ1 in BA, which is mostly in lobular areas. B) TGFβ1 expression in a liver used as control. C) Expression of α1-SMA in BA. D) α1-SMA from a liver used as control (original magnification ×10).
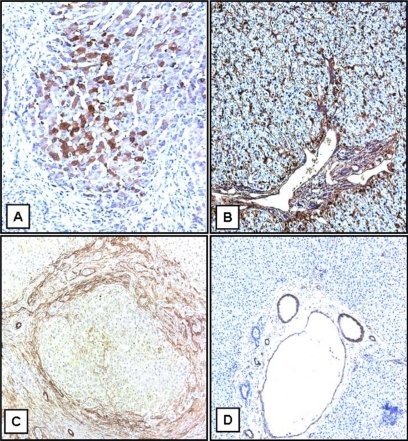
Figure 3 Pattern of hepatic distribution of TGFβ1 protein in human BA. Liver sections were obtained from archived explant specimens from patients who required LT due to BA (N = 9). The control sections were procured from the biopsies of living related liver donors. The expression of TGFβ1 was performed by immunostaining, which was quantified by using ImageJ software. From each slide, five random portal and lobular areas were analyzed. GraphPad software was used to analyze the data using t-test to compare the means of color pixel histograms from portal and lobular areas. A P value ≤ 0.05 was considered significant.
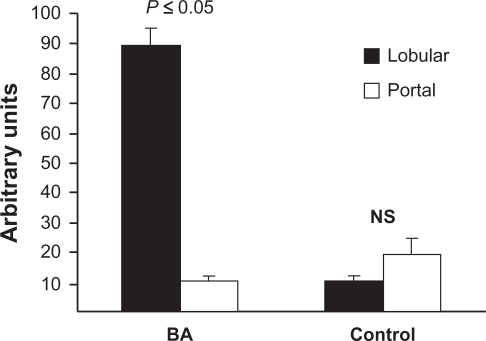
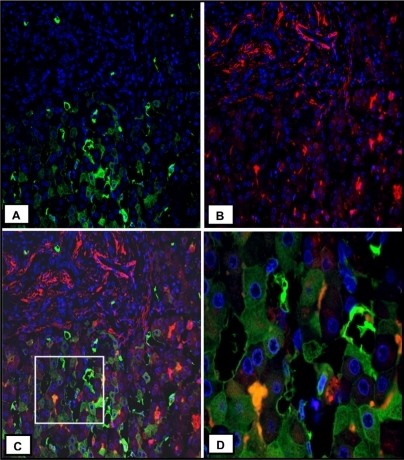
Figure 4 Characterization of hepatic cellular sources of TGFβ1 in human BA. A) Immunofluorescence staining for TGFβ1 (green, original magnification ×20). B) Immunofluorescence staining for α-SMA (red, original magnification ×20). C) Merge image of A and B. D) The original magnification ×60 of the box in C. Heterogeneous expression of TGFβ1 is seen in hepatocytes.