Figures & data
Table 2 OV metric score for noninvasive prediction of esophageal varices
Figure 1 Abdominal ultrasonography of young adult pregnant female presenting with hematemesis showed cirrhotic liver with moderate ascites and intrauterine pregnancy.
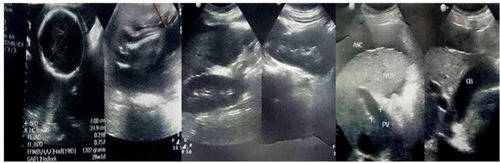
Figure 2 Colour Doppler sonography of the portal vein with maximum flow velocity of 12.7 cm/s, minimum flow velocity of 9.2 cm/s, and mean flow velocity of 11 cm/s. Portal vein cross-sectional area equals 20.4 mm.
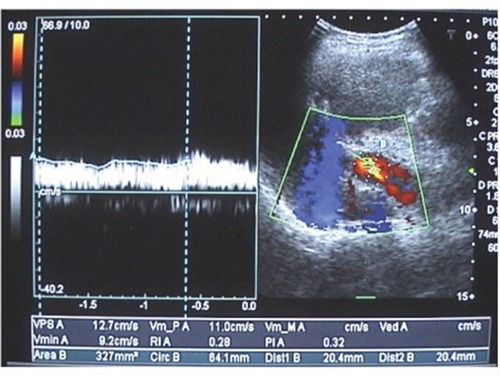
Figure 3 Doppler sonography of the right kidney showing increased renal arteriolar resistive index with a value of 0.71.
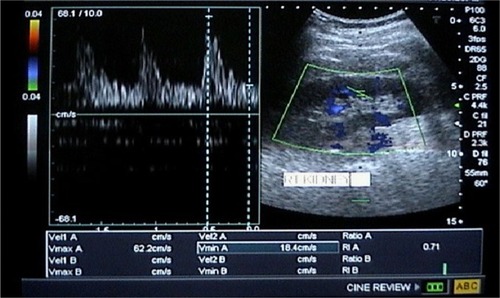
Table 3 Baseline clinical, laboratory, ultrasonographic, and Doppler criteria of the patients under study stratified by their GBS value
Table 4 Outcome of the patients under study according to GBS risk stratification
Table 5 Correlation of GBS score with endoscopy among patients with critical illness
Figure 4 Correlation between OV presence and grade with GBS score value.
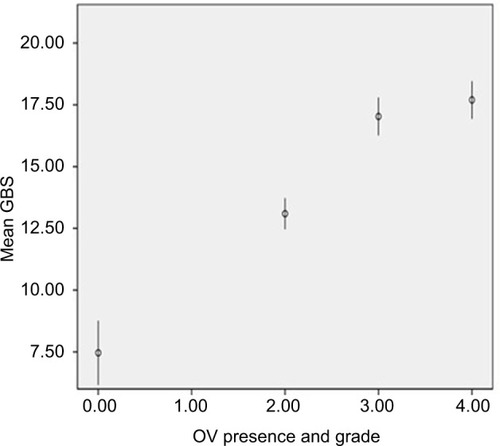
Table 6 Prevalence of OV in study population according to summed OV cirrhometric score
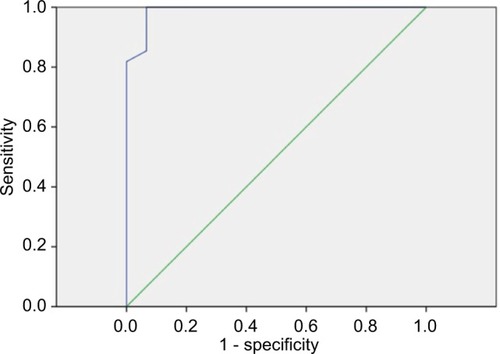
Figure 5 ROC curve for the prediction of OV in validation group.