Figures & data
Figure 1 CTT calculation method using Bernoulli’s principle.
Notes: The transit time can be calculated from the inflow volume into the lumen, the diameter, and the length of the lumen.
Abbreviation: CTT, colonic transit time.
Abbreviation: CTT, colonic transit time.
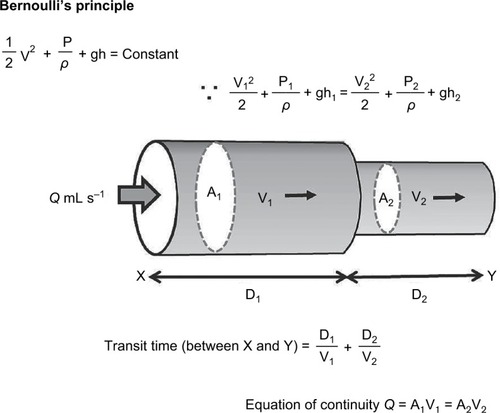
Figure 2 Setting of caliber and length.
Notes: (A) Setting of caliber and length of virtual healthy model: narrow calibers due to the sphincters were set. (B) Setting of caliber and length of virtual constipation model. (C) Setting of caliber and length of virtual diarrhea model. All lengths are given in centimeters. Italic type indicates the diameter. The number on arrow lines is the length for calculation of velocity and pressure. The number on broken lines is the length for calculation of CTT.
Abbreviations: Ba, Balli ring; Bu, Busi ring; C, Cannon ring; Ce, cecum; CTT, colonic transit time; H, Hirsch ring; M, Moultier ring; PS, Payr–Strauss ring; R, rectum; Ro, Rossi ring.
Abbreviations: Ba, Balli ring; Bu, Busi ring; C, Cannon ring; Ce, cecum; CTT, colonic transit time; H, Hirsch ring; M, Moultier ring; PS, Payr–Strauss ring; R, rectum; Ro, Rossi ring.
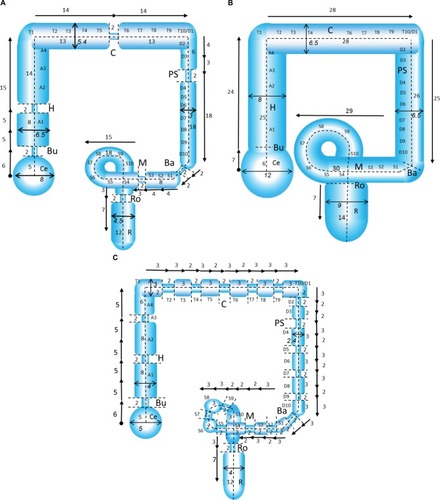
Figure 3 Comparison of the velocity in the VHM, VCM, and VDM.
Note: In the VCM, the unit of velocity differed by 2 digits.
Abbreviations: VCM, virtual constipation model; VDM, virtual diarrhea model; VHM, virtual healthy model.
Abbreviations: VCM, virtual constipation model; VDM, virtual diarrhea model; VHM, virtual healthy model.
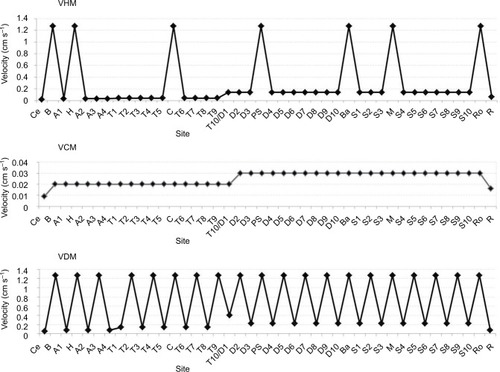
Figure 4 Comparison of transit times in each model.
Note: Results with bolus flow volume (1 mL s–1)
Abbreviations: VCM, virtual constipation model; VDM, virtual diarrhea model; VHM, virtual healthy model.
Abbreviations: VCM, virtual constipation model; VDM, virtual diarrhea model; VHM, virtual healthy model.
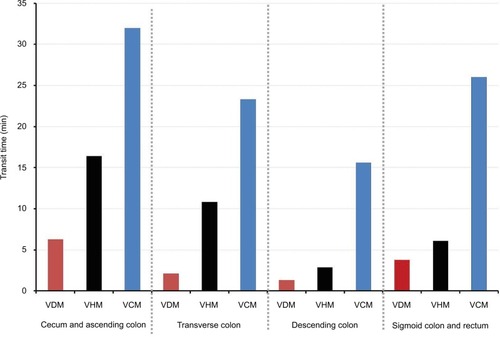
Figure 5 Inflow volume and CTT in the VHM, VCM, and VDM.
Abbreviations: CTT, colonic transit time; VCM, virtual constipation model; VDM, virtual diarrhea model; VHM, virtual healthy model.
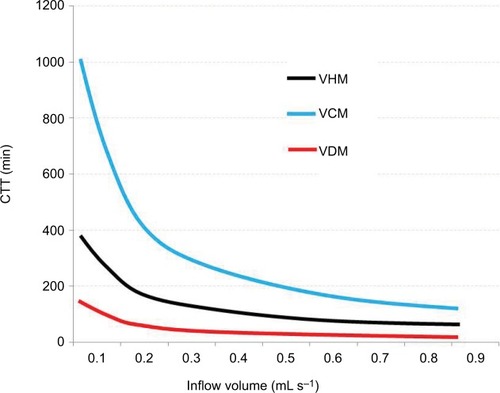
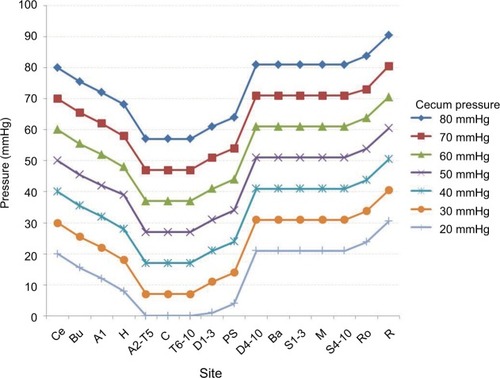
Figure 6 The relationship between cecal pressure (20–80 mmHg) and pressure changes at each site.