Figures & data
Table 1 Search formula
Figure 1 Flow diagram of study selection.

Table 2 Characteristics of RCTs regarding effect of RMD on the bowel movements
Table 3 Risk of bias of RCTs regarding effect of RMD on the bowel movements
Figure 2 Forest plot for the effect of RMD on stool volume.
Abbreviations: RMD, resistant maltodextrin; IV, inverse variance.
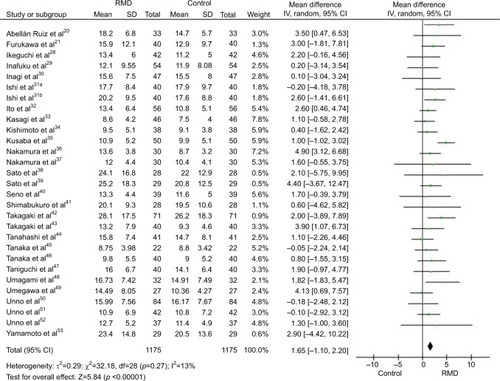
Figure 3 Forest plot for the effect of RMD on stool frequency.
Abbreviations: RMD, resistant maltodextrin; IV, inverse variance.
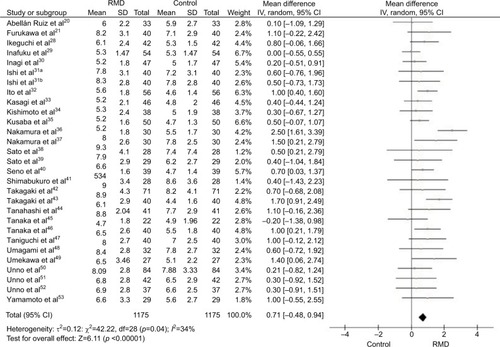
Figure 4 Funnel plot of publication bias for the effect of RMD on stool frequency.
Notes: (A) Original data; (B) after correction by the trim and fill method.
Abbreviation: RMD, resistant maltodextrin.
Abbreviation: RMD, resistant maltodextrin.
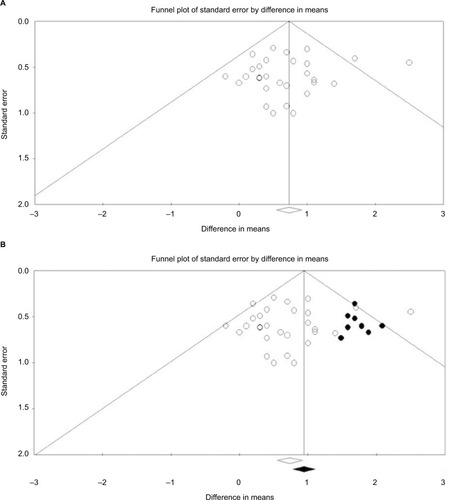
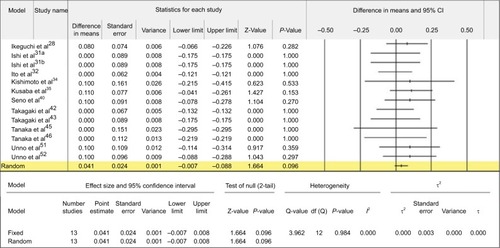
Figure 5 Forest plot for the effect of RMD on the sensation of complete/incomplete evacuation.
Abbreviation: RMD, resistant maltodextrin.