Figures & data
Table 1 Demographic features of 71 patients with Crohn’s disease (CD) and 26 with idiopathic ulcerative colitis (UC). Data are listed for time-dependent variables as prior to infliximab (IFX) infusion. “General” refers to any time up to 1 month pre-IFX. Marginally significant differences were noted for fistulae by disease type (exact P = 0.06) and surgery before IFX by disease type (exact P = 0.09). No other differences were statistically significant
Table 2 Laboratory values for patients with Crohn’s disease (CD) or idiopathic ulcerative colitis (UC). Values are listed as during a general period, 1 month prior to infliximab (IFX) infusion, and general after IFX infusion. Sample sizes are noted for each statistic. Mean values are provided. Bracketed values represent SD
Table 3 Characteristics of infliximab treatment for patients with Crohn’s disease (CD) and idiopathic ulcerative colitis (UC)
Figure 1 The distribution of the number of infusions (by year) and year of start of IFX treatment by disease group are shown (N = 97). Some patients who were tracked at infusion centers during the period of interest of the study began therapy earlier (also described in Methods).
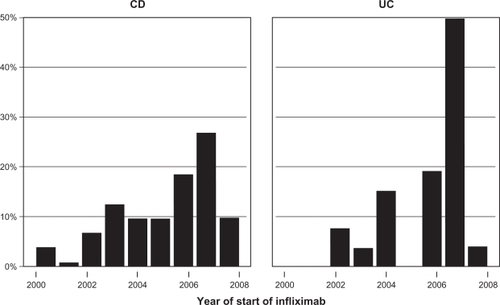
Figure 2 Length of treatment for CD and/or UC is shown for the duration of the observational period of 76 months (log-rank P = 0.5; n = 97).
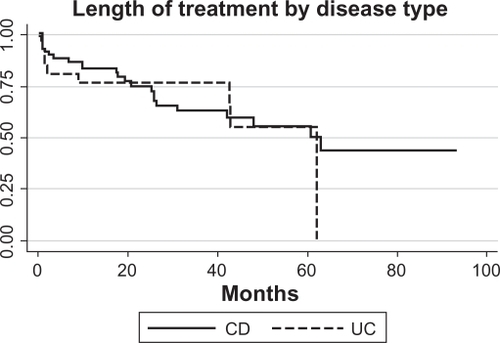
Table 4 Summary of therapeutic failures (primary and Grade A), adjustment requirements (Grade B), or ongoing therapy without primary or Grade A failure
Figure 3 Survival analysis of CD (N = 9/52) and UC (N = 2/19) patients who developed Grade A failure (need to stop infliximab for medical reasons and alter therapy). Only patients who did not have primary failure were included, and three patients were missing sufficient data.
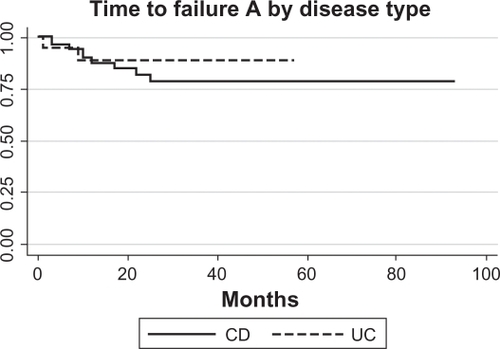
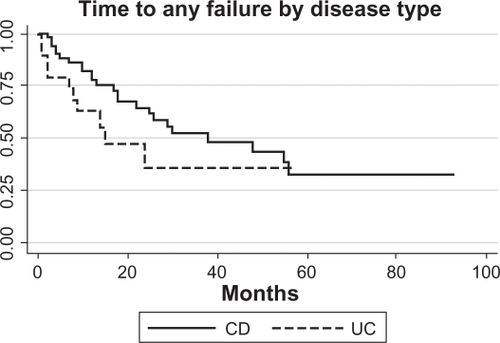
Figure 4 Survival analysis CD (N = 24/52) and UC (N = 10/19) patients who developed Grade A failure and/or Grade B failure (need to alter frequency or dose of infliximab therapy). Only patients who did not have primary failure were included, and three patients were missing data.