
Figures & data
Figure 1 Distribution of patients with CD (n=10.451) and UC (n=12.187) by age in the State of São Paulo (Brazil) for the period of 2012–2015.
Abbreviations: CD, Crohn’s disease; UC, ulcerative colitis.
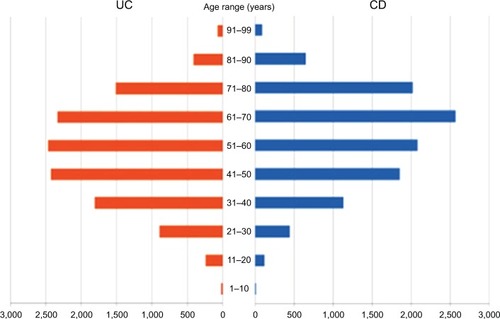
Figure 2 Annual incidence rates for IBD, CD, and UC in the State of São Paulo.
Note: Data are presented as new cases per 100,000 inhabitants/year.
Abbreviations: CD, Crohn’s disease; IBD, inflammatory bowel disease; UC, ulcerative colitis.
Abbreviations: CD, Crohn’s disease; IBD, inflammatory bowel disease; UC, ulcerative colitis.
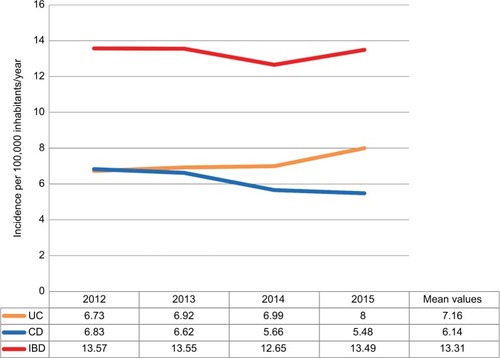
Figure 3 Annual incidences of IBD, CD, and UC among the female participants in the State of São Paulo for the period of 2012–2015.
Notes: Data are presented as new cases per 100,000 inhabitants/year.
Abbreviations: CD, Crohn’s disease; IBD, inflammatory bowel disease; UC, ulcerative colitis.
Abbreviations: CD, Crohn’s disease; IBD, inflammatory bowel disease; UC, ulcerative colitis.
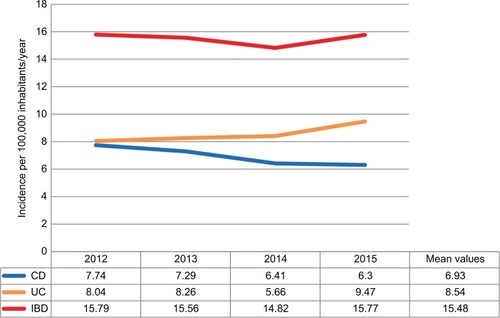
Figure 4 Annual incidences of IBD, CD, and UC among the male participants in the State of São Paulo for the period of 2012–2015.
Note: Data are presented as new cases per 100,000 inhabitants/year.
Abbreviations: CD, Crohn’s disease; IBD, inflammatory bowel disease; UC, ulcerative colitis.
Abbreviations: CD, Crohn’s disease; IBD, inflammatory bowel disease; UC, ulcerative colitis.
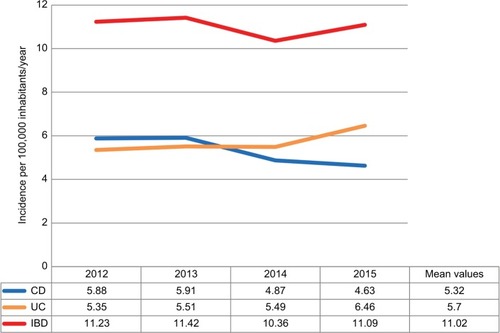
Table 1 Prevalence of IBD in the State of São Paulo in December 2015
Table 2 Data from the present study and from the previous studies related to the IBD epidemiology in Brazil