Figures & data
Table 1 Baseline demographic and clinical characteristics of the participants
Table 2 Mean values or frequencies and differences in improvement with overall P-values after treatment (repeated measures analysis)
Figure 1 Flow chart of the patients.
Abbreviation: CTT, conventional triple therapy.
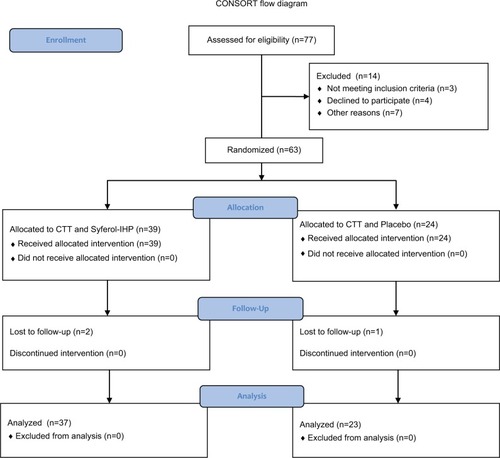
Figure 2 Special stain (Giemsa) ×400 showing Helicobacter pylori organisms (arrow) within the gastric gland.
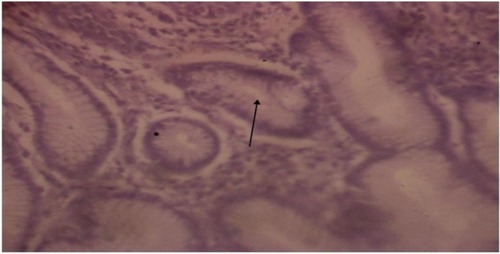
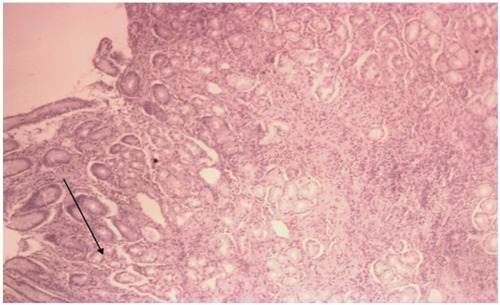
Figure 3 Severe chronic gastritis ×100 magnification.
Note: Lymphocytic infiltrates (arrow) are seen forming follicle (pretreatment result).
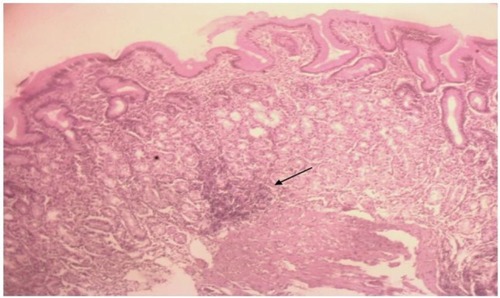
Figure 4 Mild gastric chronic inflammation (posttreatment result).