Figures & data
Figure 1 Crohn’s disease phenotypic behavior over time, according to Montreal classification at diagnosis and follow-up in 404 pediatric patients. Dramatic changes occurred in the proportion of disease behavior subgroups – from inflammatory nonpenetrating, nonstricturing disease (B1) to stricturing (B2) or penetrating disease (B3) (P < 0.01).
Copyright © 2004, Elsevier. Reproduced with permission from Vernier-Massouille et al.Citation31
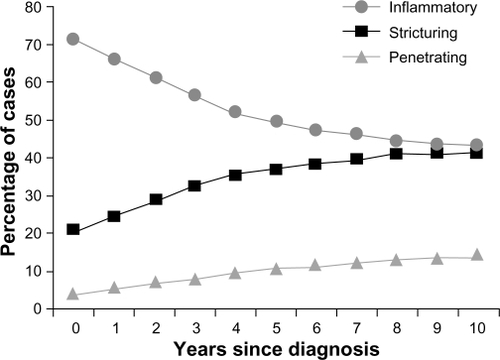
Table 1 Seroprevalence of ASCA positivity, IgA and IgG in non-IBD disease
Table 2 Summary of seromarker characteristics in IBD
Table 3 Studies of serologic panels in predicting disease phenotype in Crohn’s disease
Figure 2 Frequency of complicated small bowel disease, as represented by antibody quartile sum score. A summation score of 3–12 for antibody titers toward I2, OmpC, and ASCA was calculated and categorized into quartiles (QSS). Patients with higher sum scores had greater frequency of complicated course (fibrostenosing, penetrating, or small bowel disease, or need for surgery).
Copyright © 2008, Elsevier. Reproduced with permission from Mow et al.Citation71
Abbreviations: ASCA, antibodies to Saccharomyces cerevisiae; OmpC, outer membrane porin C; QSS, quartile sum score; UC, ulcerative colitis.
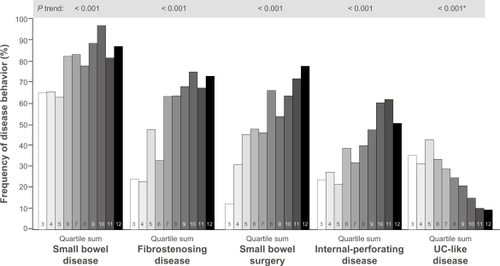
Figure 3 Kaplan–Meier plot estimates for internal-penetrating/stricturing disease and need for bowel surgery by QSS of antibody titers toward I2, OmpC, and ASCA among CD patients. The figure depicts a higher probability of maintaining a simple, noncomplicated disease course during prospective follow-up, among those patients who fall into the lower QSS groups (QSS groups 1 and 2) (A). Conversely, half of the patients in QSS group 3 required surgery within 100 months of follow-up (B).
Copyright © 2008, Elsevier. Reproduced with permission from Dubinsky et al.Citation75
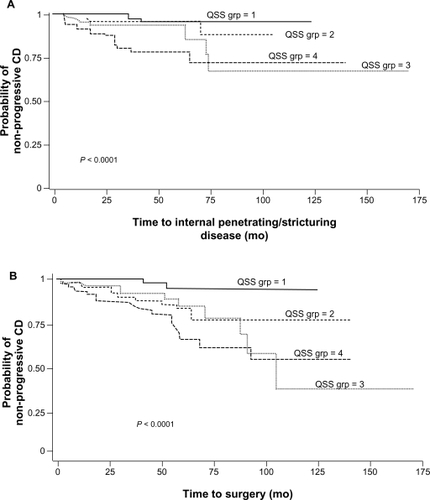
Table 4 Significant individual associations of antibody responses and NOD2/CARD15 genotype with Crohn’s disease phenotypesCitation71,Citation89,Citation97
Figure 4 Frequency of carriage of NOD2/CARD15 variant relative to semiquantitative antibody reactivity, as represented by quartile sum (range 4–16). The dotted line represents the mean 31.8% frequency of carriage of at least one NOD2/CARD15 variant, across the entire cohort.
Copyright © 2007, Elsevier. Reproduced with permission from Devlin et al.Citation111
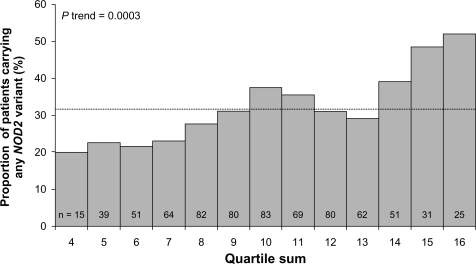
Table 5 Demonstration of synergism between NOD2 variants and antibody levels in fibrostenosis