
Figures & data
Figure 1 Incidence and mortality rates of EC.
Abbreviation: EC, esophageal cancer.
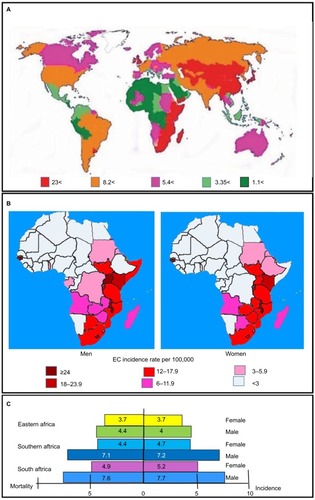
Table 1 Alcohol consumption and tobacco use in China and South Africa
Figure 2 Geographic locations of the four high-risk areas in China.
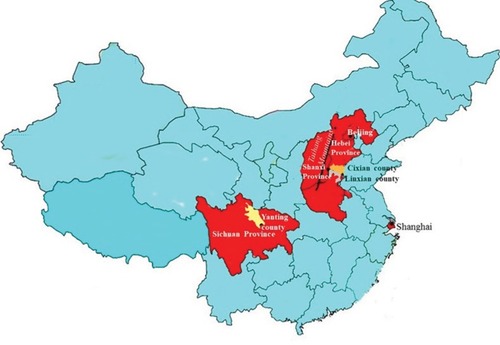
Table 2 Comparison of the risk factors for adenocarcinoma and ESCC
Table 3 Genetic polymorphisms affecting the genes related to changing the risk of developing esophageal cancer in South Africa and China
Table 4 Genetic polymorphisms in alcohol metabolizing enzymes associated with EC in South Africa and China
Table 5 GST polymorphisms involved in esophageal cancer
Table 6 Genetic polymorphisms in DNA mismatch repair genes that influence the risk of developing esophageal carcinoma in South Africa and China
Table 7 Genetic polymorphisms in CYP/CYP450 genes relating to ESCC in South Africa and China
Table 8 The extent to which different risk factors influence the odds of developing ESCC in Swedish males and femalesCitation165