Figures & data
Table 1 Diagnostic criteria according to the latest issue of “Rome II”Citation2
Table 2 Subtyping of IBS by predominant stool pattern modified according to LongstrethCitation2
Figure 1 Gender-dependent age distribution of patients at onset of IBS symptoms.
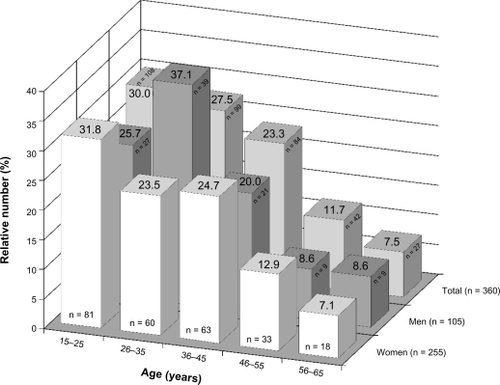
Figure 2 Gender-dependent distribution of duration of IBS symptoms at first diagnosis.
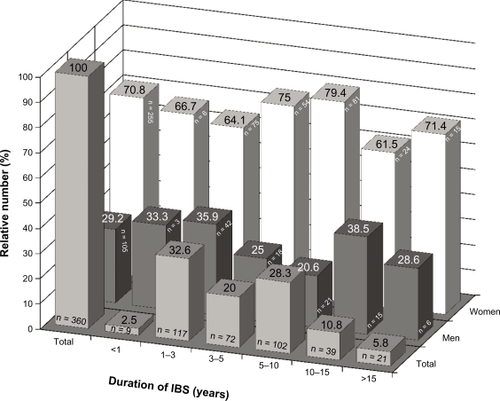
Figure 3 Age distribution of IBS categories.
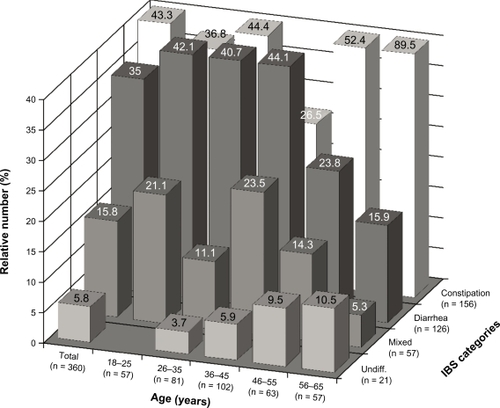
Figure 4 Frequency of predisposing factors (100% equals n = 360).
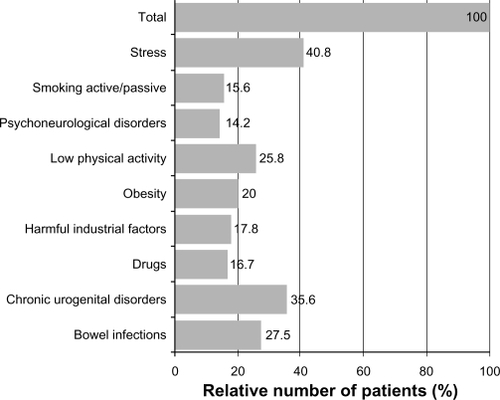
Figure 5 Pain intensity judged by patients with different categories of IBS (constipation, diarrhea, mixed and undifferentiated type) on a visual analog scale (0–10).
Abbreviation: IBS, Irritable Bowel Syndrome.
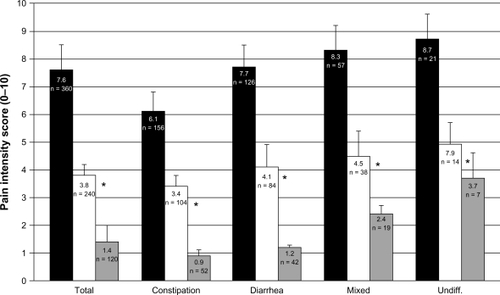
Figure 6 Pain duration (hours per day) in patients with different categories of IBS (constipation, diarrhea, mixed and undifferentiated type).
Abbreviation: IBS, Irritable Bowel Syndrome.
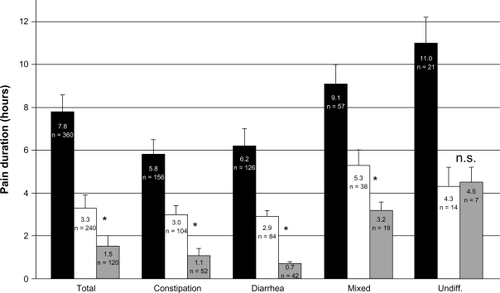
Figure 7 Incidence of stool abnormalities (%) in patients with different categories of IBS (constipation, diarrhea, mixed and undifferentiated type).
Abbreviation: IBS, Irritable Bowel Syndrome.
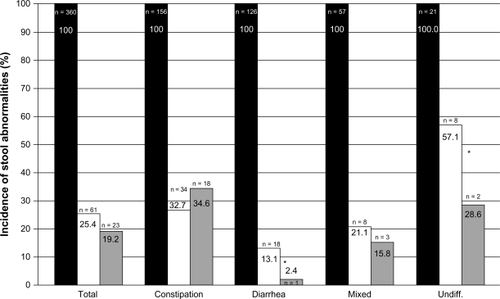
Figure 8 Incidence of meteorism (%) in patients with different categories of IBS (constipation, diarrhea, mixed and undifferentiated type).
Abbreviation: IBS, Irritable Bowel Syndrome.
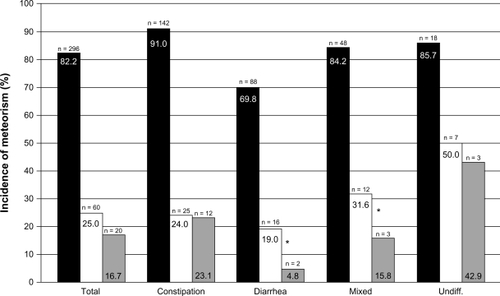
Figure 9 Incidence (%) of cytomorphologic parameters in patients with different categories of IBS (constipation, diarrhea, mixed and undifferentiated type).
Abbreviation: IBS, Irritable Bowel Syndrome.
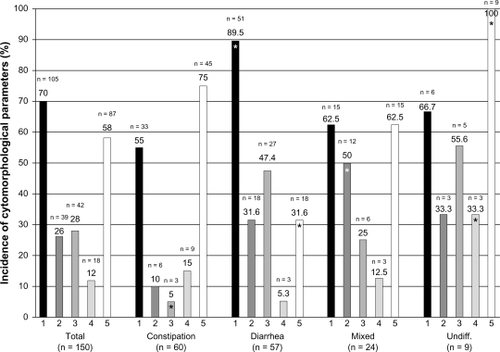
Figure 10 Incidence of cytomorphologic parameters after 28 day of treatment with mesalazine (white columns) compared with controls (black columns).
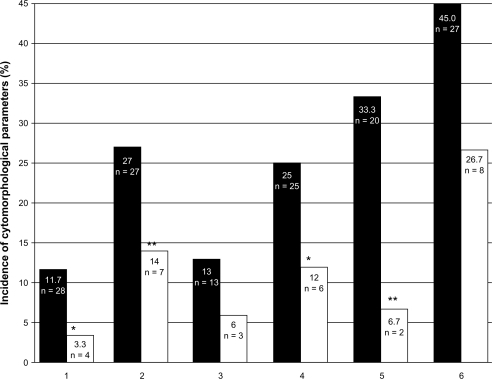
Figure 11 Colon mucosa of IBS patient (1 – columnar epithelium, 2 – goblet cells, 3 – endocrinocytes, hematoxylin-eosin staining, bar = 100 μm).
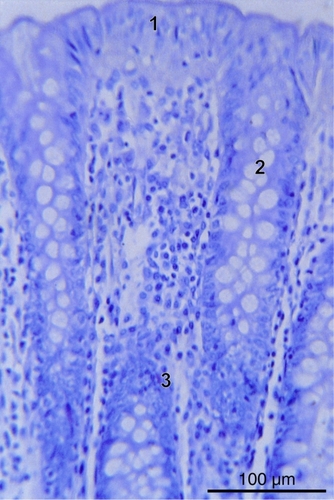
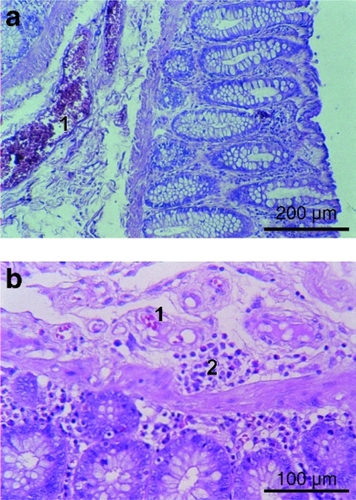
Figure 12 Flattening of superficial epithelium (1) in colon mucosa in IBS patient (hematoxylin-eosin staining, bar = 200 μm).
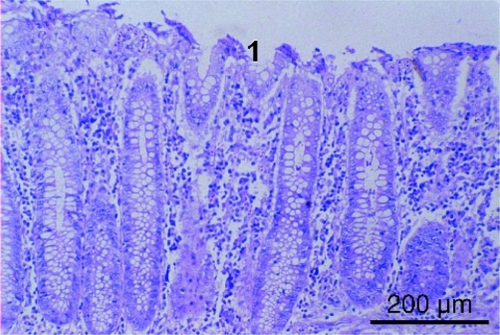
Figure 13 Goblet cells (1), crypts (2) in colon mucosa in IBS patient (hematoxylineosin staining, bar = 100 μm).
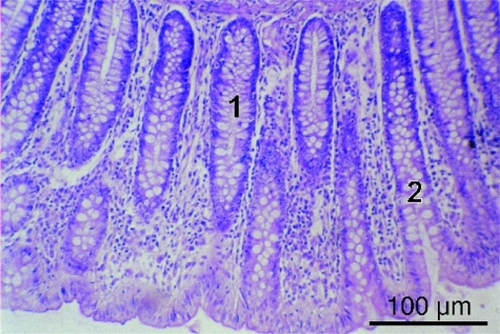
Figure 14 Cell infiltrations A) and edema B) in colon mucosa in IBS patient (1 – plasmocytes, 2 – lymphocytes, 3 – eosinophils, 4 – fibroblasts, hematoxylineosin staining). Bars = 50 μm.
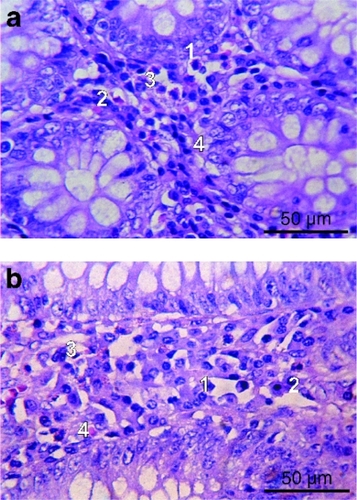
Figure 15 Plethora of microcapillaries A) and areas of cell infiltrations in the submucous layer of the submucosa B) of IBS patient (1 – microcapillaries with venous stasis phenomena, 2 – plasmocytic infiltrations, hematoxylin-eosin staining). Bars: a = 200 μm, b = 100 μm.