
Figures & data
Table 1 Disease extent and behavior at diagnosis according to the Paris classification and treatments in pediatric IBD patients
Table 2 Demographics and laboratory tests of IBD, non-IBD patients, and healthy controls at baseline
Figure 1 Faecalibacterium prausnitzii abundance in IBD patients according to whether they had received antibiotics prior to the diagnosis (measured in fluorescence signal strength in 1,000 units).
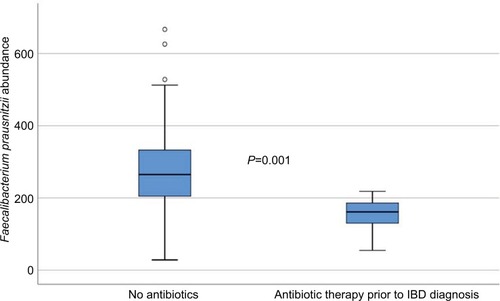
Figure 2 Boxplot illustrating the differences in the total fluorescence signal strength measured in 1,000 units between IBD, non-IBD symptomatic patients, and healthy controls.
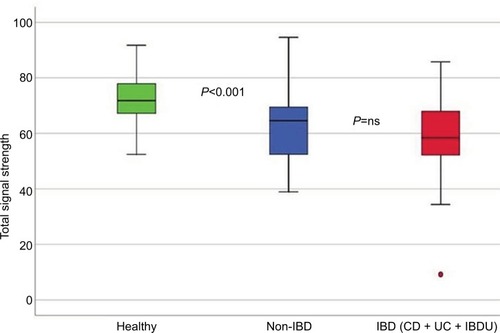
Figure 3 Principal component analysis, illustrating the difference in microbiota abundance of all 54 bacterial probes between IBD, non-IBD symptomatic patients, and healthy controls.
Abbreviations: IBD, inflammatory bowel disease; PCA, principal component analysis.
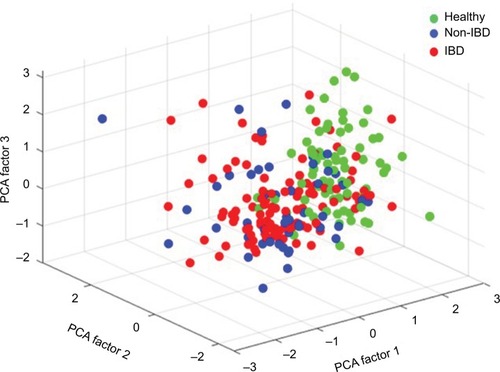
Figure 4 Sensitivity and specificity of Proteobacteria, Enterobacteriaceae, and Shigella/Escherichia abundance in differentiating Crohn’s disease phenotypes (stricturing/penetrating vs inflammatory disease behavior) using the area under the receiver operating characteristics curve analysis.
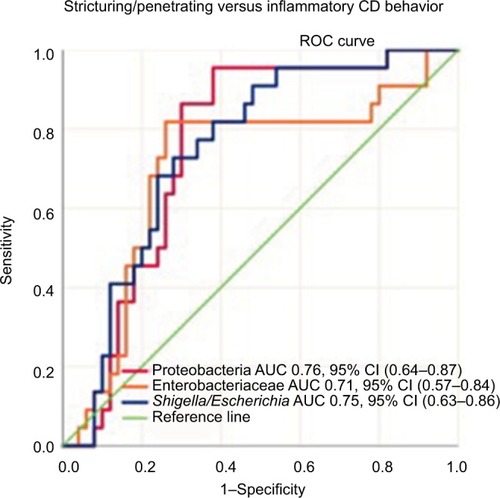
Figure 5 Sensitivity and specificity of Firmicutes and Mycoplasma hominis abundance in differentiating conventional- vs biologic therapy-treated IBD patients using the area under the receiver operating characteristics curve analysis.
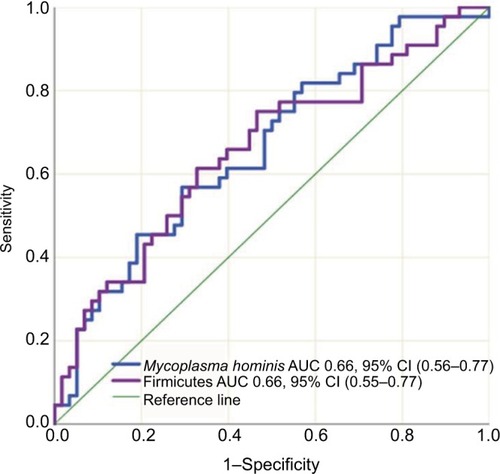
Figure 6 Proteobacteria abundance in IBD patients according to whether they needed surgery or not (measured in fluorescence signal strength in 1,000 units).
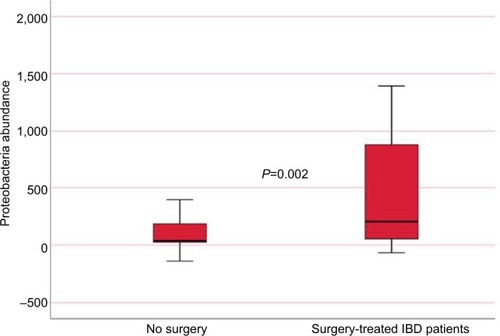
Table S1 List of phyla and bacterial names of the GA-Map™ technology markers