
Figures & data
Figure 1 EsophaCap is an encapsulated sponge (A) attached to a tether (B).
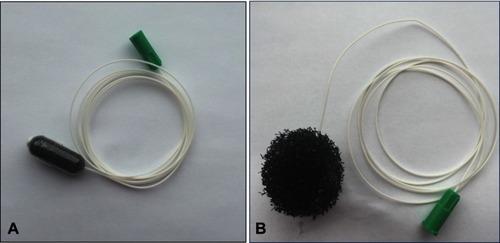
Table 1 Diagnostic categories of esophageal glandular cells in EsophaCap cytology sample
Figure 2 Intestinal metaplasia with no high-grade dysplasia (IMNHGD) and columnar cell with no goblet cells (CCNGC) of EsophaCap samples. (A) CCNGC: The specimen consists of multiple squamous cells and one sheet of glandular cells. The glandular cells are well organized. No goblet cells are identified. (B) IMNHGD: The specimen consists of multiple sheets of glandular cells. The glandular cells are well organized. Focal goblet cells are present (arrowhead). (C and E) CCNGC: One columnar cell gland is present in cell block. The columnar cells are negative for MUC2 immunostain; (D and F) IMNHGD: Goblet cells are present in cell block. The goblet cells and adjacent columnar cells are positive for MUC2 immunostain.
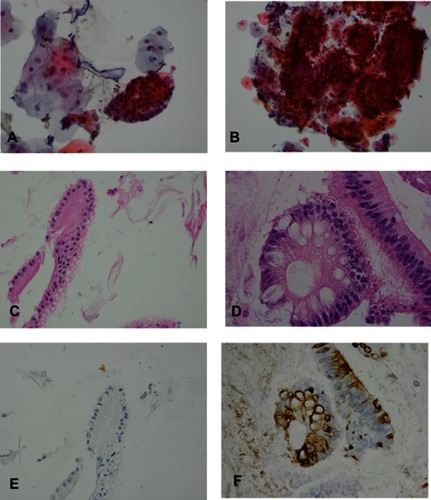
Table 2 Number of surgical biopsy and cytology cases with each category
Figure 3 Atypical glandular cells (AGC), suspicious for esophageal adenocarcinoma (SFEAC) and esophageal adenocarcinoma (EAC). (A and B) AGC: The specimen consists of a sheet of glandular cells with increased nuclear size and prominent nucleoli (see arrow). (C and D) SFEAC: The specimen consists of rare cluster of glandular cells with high nuclei/cytoplasm ration, irregular nuclear contour, prominent nucleoli, hyperchromasia and overlapping. (E and F) EAC: The specimen consists of multiple clusters of glandular cells with high nuclei/cytoplasm ration, prominent nucleoli, irregular nuclear contour, hyperchromasia, mitosis (see arrowhead), overlapping and the single cells.
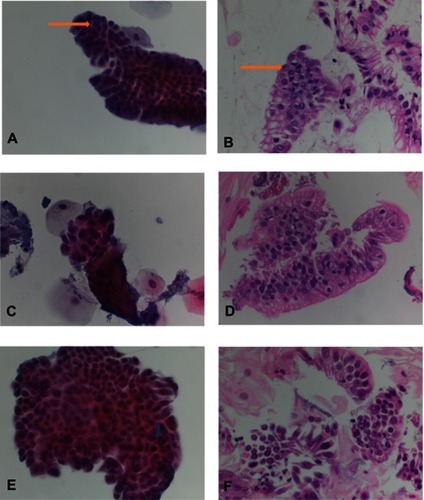
Table 3 Number of glandular cell (GC) clusters in cell block
Figure 4 MUC2 immunohistochemical study (IHC) in esophageal tissue microarray (TMA). (A) Columnar cell metaplasia with negative MUC2 immunostain; (B) Barrett’s esophagus with positive MUC2 immunostain; (C) Low-grade dysplasia with positive MUC2 immunostain; (D) High-grade dysplasia with positive MUC2 immunostain; (E) Esophageal adenocarcinoma with negative MUC2 immunostain; (F) Esophageal adenocarcinoma with positive MUC2 immunostain.
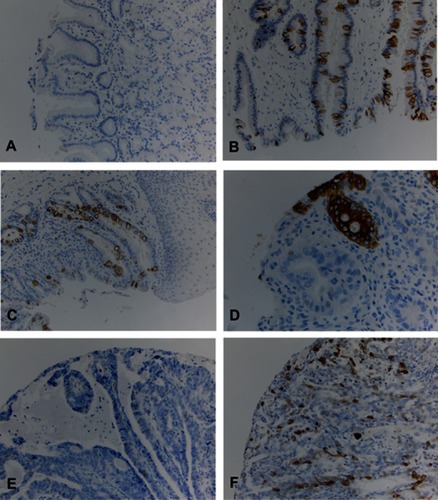
Table 4 MUC2 immunohistochemistry in esophageal tissue microarray