
Figures & data
Box 1 Survey questionnaire
Table 1 Baseline characteristics at inclusion
Box 2 Rome 3 criteria
Table 2 Mean scores of SF-36 questionnaire items and differences comparison between groups
Figure 1 Distribution and trend of means scores of SF-36questionnaire items adjusted to age within all subgroups. Lines were smoothed because of the presence of one subject in the belonging age class.
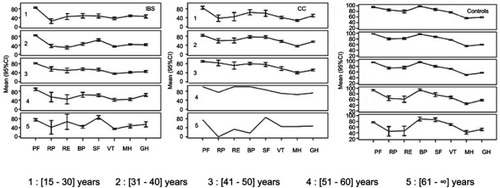
Table 3 Distribution of the scores of SF-36 questionnaire according to the gender within the subgroup of subjects with irritable bowel syndrome, chronic constipation, or control subjects
Figure 2 Box plots depicting the distribution and trends of physical (A) and mental (B) composite scores between patients with irritable bowel syndrome, chronic constipation, and control subjects. The box represents the interquartile range; the top and the bottom of the box are, respectively, the 25th and 75th percentile. The line across the box is the median. The lower and upper values are indicated by the whiskers. Stars and circles represent the outliers and extreme values.
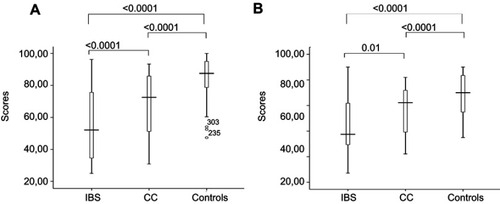
Figure 3 Box plots depicting the distribution, comparison, and trends of physical (A) and mental (B) composite summaries between subjects with no painful chronic constipation (0), painful chronic constipation (1) and irritable bowel syndrome (2). The box represents the interquartile range; the top and the bottom of the box are, respectively, the 25th and 75th percentile. The line across the box is the median. The lower and upper values are indicated by the whiskers. Stars and circles represent outliers and extreme values. SE: standard error, Q = calculated statistic, Q(0.05): the critical value of tabled Q statistic =2.39. KW = Kruskal Wallis test.
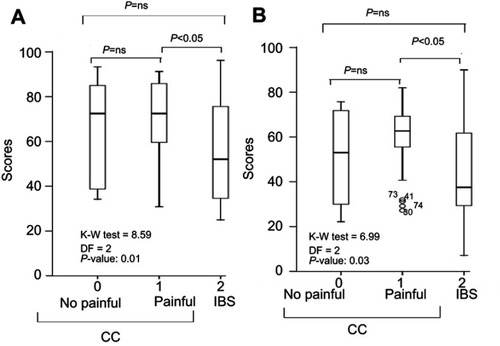
Table 4 Predictive factors affecting physical and mental composite summaries of the SF-36 scores in subjects with irritable bowel syndrome compared with those with chronic constipation: multivariate regression analysis