
Figures & data
Figure 1 Study design.
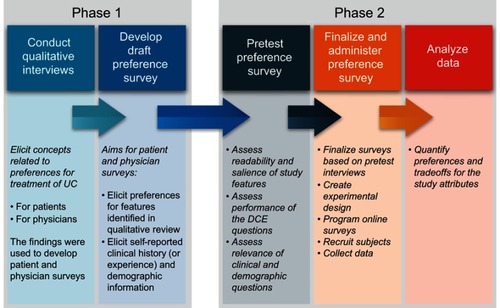
Table 1 Attributes and levels for the treatment profiles
Figure 2 Example choice question.
Abbreviation: UC, ulcerative colitis.
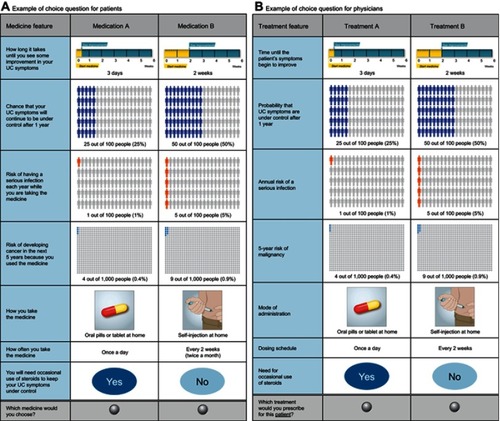
Table 2 Respondent characteristics
Table 3 Maximum acceptable percentage-point increase in annual risk of serious infection
Figure 3 Preference weights.
Notes: This graph presents the preference weights placed on the attribute levels represented on the horizontal axis. Vertical distance between the preferences for various levels of the same attribute represents the weight placed on a specific relative change in that attribute. Calculated mean preference estimates for each value can be compared within each attribute and across different attributes. The vertical bars surrounding each mean preference weight denote the 95% confidence interval about the point estimate (computed by delta method).
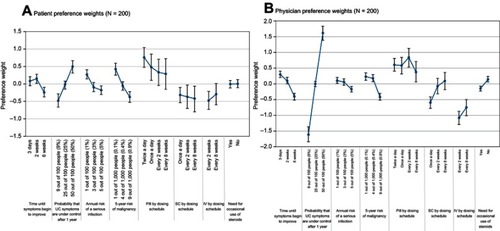
Figure 4 Conditional relative importance for patients and physicians.
Abbreviations: IV, intravenous; SC, subcutaneous; UC, ulcerative colitis.
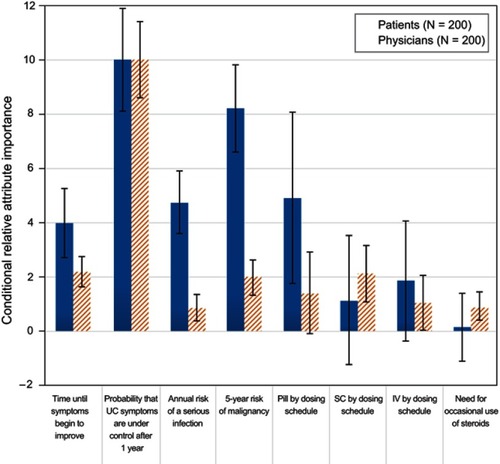
Table 4 Maximum acceptable 1/10 of percentage-point increase in 5-year risk of malignancy
Data availability
The data used in the analyses are available from the corresponding author on reasonable request.