Figures & data
Figure 1 Data obtained from running capacity test of ob/ob mice after 8 weeks of aerobic exercise protocol.
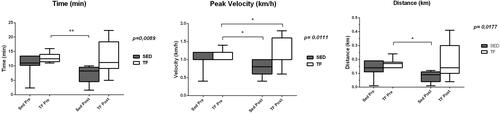
Table 1 Primers Sequence (Forward/Reverse) Used in the qRT-PCR Reaction for Each Gene Studied
Table 2 Bodyweight Gain and Food Intake at the End of the Experimental Protocol
Figure 2 Average bodyweight and bodyweight gain during 8-week aerobic physical training protocol of both study groups.
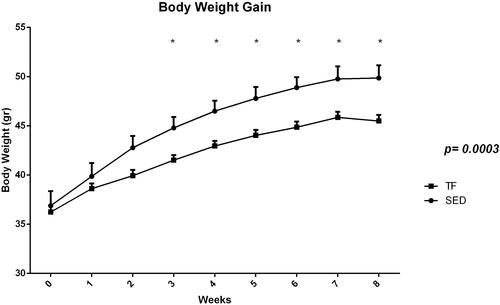
Table 3 Adipose Tissues and Hepatic Weight of ob/ob Mice from Both Groups at the End of the Aerobic Exercise Protocol (Absolute and Relative Weight)
Table 4 Histologic Features of Hepatic Tissue in ob/ob Mice
Figure 3 Liver histology of ob/ob mice. (A and B) Liver histology of sedentary animals (100 µm scale). (C and D) Liver histology of trained animals (100 µm scale).
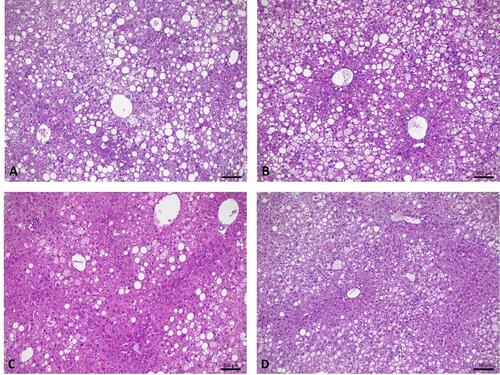
Table 5 Description of Pancreatic Histological Analysis Performed in Both Study Groups After 8 Weeks of Aerobic Exercise Protocol
Figure 4 Pancreatic histology of sedentary ob/ob mouse without fat infiltration. 1 = Langerhans islet; 2 = blood vessel (original magnification ×40).
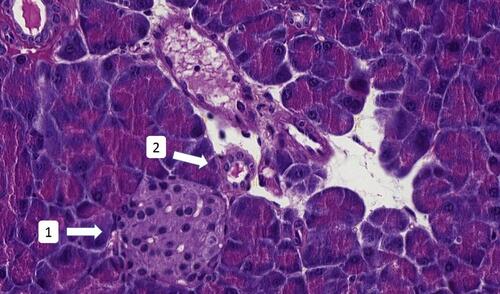
Figure 5 Panoramic view of the sedentary ob/ob mouse pancreas with preserved morphology and tissue (original magnification ×20).
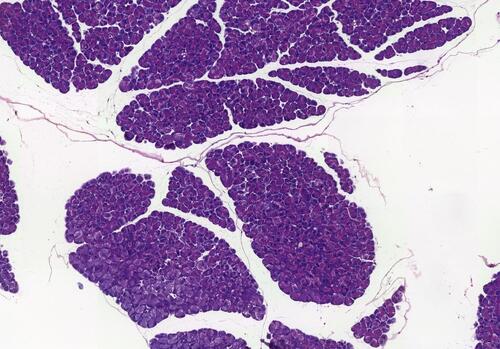
Figure 6 Sedentary ob/ob mouse pancreatic accino. Presence of rare lymphocytes (arrow) in loose periacinar tissue (original magnification ×40).
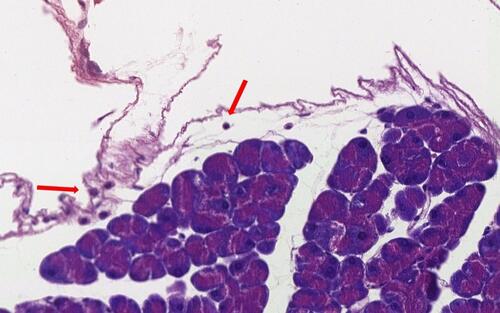
Figure 7 ob/ob trained mouse pancreas with visceral fat adjacent (arrow) to pancreatic parenchyma with no signs of lobular infiltration (original magnification ×5).
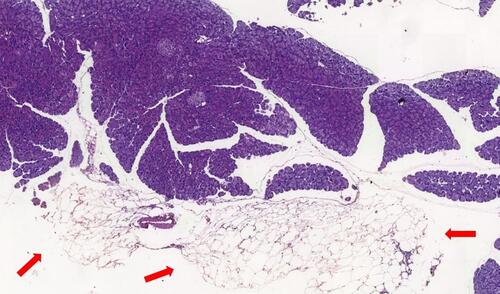
Figure 8 Hepatic expression of genes related to insulin resistance between groups.
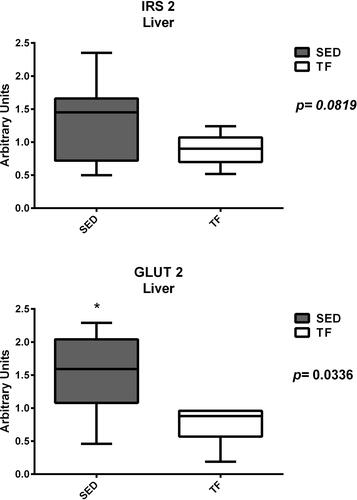
Figure 9 Hepatic expression of genes related to inflammation between groups.
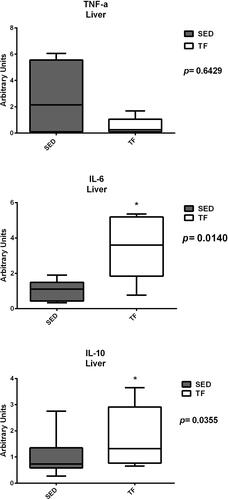
Figure 10 Pancreatic expression of genes related to insulin resistance between groups.
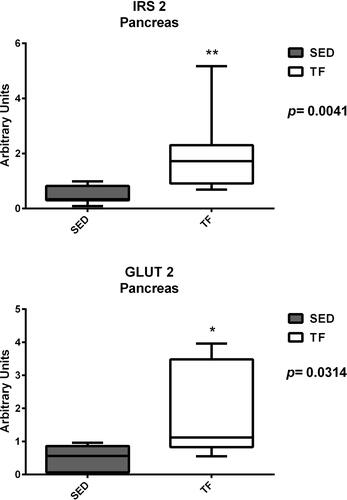
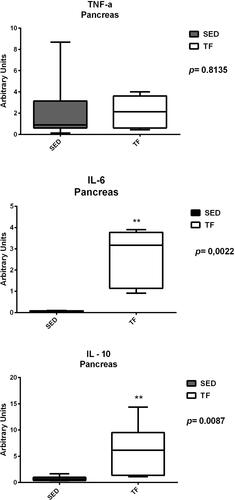
Figure 11 Pancreatic expression of genes related to inflammation between groups.