Figures & data
Figure 1 Phagocytosis and production of TNF-α by isolated hepatic and splenic macrophages Phagocytosis of isolated hepatic or splenic Mfs is shown. (A), count of FITC-labeled beads per Mfs; and (B), percentage of Mfs with FITC-labeled beads to all Mfs. Production of TNF-α by isolated hepatic or splenic Mfs stimulated with LPS is shown as described in the Materials and Methods. (C), isolated hepatic Mfs; and (D). Isolated splenic Mfs. Data represent means by ANOVA with Bonferroni’s post hoc test. Data represent means ± SEM (n = 5 in each group). *p <0.05 and **p <0.01 compared with the control by ANOVA with Bonferroni’s post hoc test. #p <0.05 and ##p <0.01 compared with the NASH group by ANOVA with Bonferroni’s post hoc test.
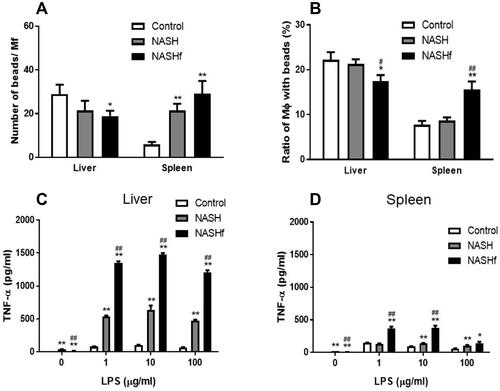
Figure 2 Production of IL-6 and IL-10 by isolated tissue macrophages. Production of IL-6 and IL-10 by isolated hepatic or splenic Mfs stimulated with LPS is shown as described in the Materials and Methods. (A), production of IL-6 by isolated hepatic Mfs; (B), production of IL-6 by isolated splenic Mfs; (C), production of IL-10 by isolated hepatic Mfs; and (D), production of IL-10 by isolated splenic Mfs. Data represent means ± SEM (n = 5 in each group). *p <0.05 and **p <0.01 compared with the control by ANOVA with Bonferroni’s post hoc test. #p <0.05 and ##p <0.01 compared with the NASH group by ANOVA with Bonferroni’s post hoc test. †p <0.05 and ††p <0.01 compared with the NASHf by ANOVA with Bonferroni’s post hoc test.
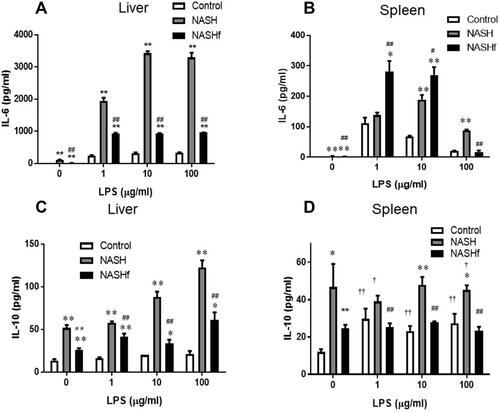
Figure 3 Immunohistochemical staining for CD68 and F4/80. (A), The number of CD68-positive cells in the liver or spleen; (B), The number of F4/80-positive cells in the liver or spleen; and (C), Percentage of F4/80-positive cells to CD68-positive cells is shown. Data represent means ± SEM (n = 5 in each group). *p <0.05 and **p <0.01 compared with the control by ANOVA with Bonferroni’s post hoc test. #p <0.05 compared with the NASH group by ANOVA with Bonferroni’s post hoc test.
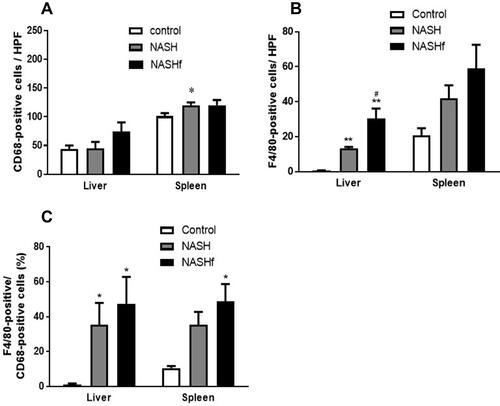
Figure 4 Double immunofluorescence staining for CD14 and CD16. (A), The number of CD14+CD16− cells and (B), the number of CD14+16+ cells in the liver are shown. (C), the positive area/whole area (%) of CD14+CD16− cells in the spleen; and (D), the positive area/whole area (%) of CD14+CD16+ cells in the spleen are shown. Data represent means ± SEM (n = 5 in each group). *p < 0.05 compared with the NASH group by ANOVA with Bonferroni’s post hoc test.
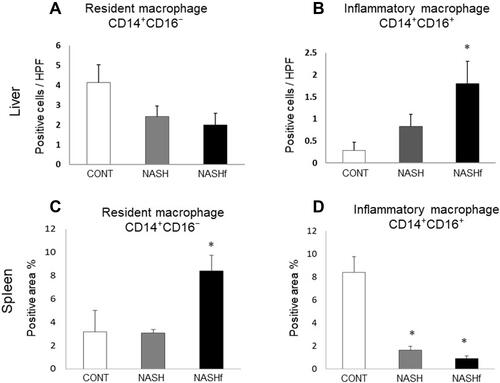
Figure 5 Liver pathology after the EGFP cell transplantation, and population of EGFP-positive cells and double immunofluorescence staining for CD68 and F4/80 in the liver of animals without splenectomy. Representative photomicrographs are shown. (A), liver tissues in normal animals fed chow diet for 12 weeks without the EGFP cell transplantation. Mice without splenectomy were sacrificed at 4 weeks (B), 8 weeks (C), and 12 weeks (D) after EGFP cell transplantation. (E), CD68 staining and F4/80 staining in the liver 16 weeks after the cell transplantation in animals without the splenectomy; and (F), CD68 staining and F4/80 staining in the liver 16 weeks after the cell transplantation in animals without the splenectomy.
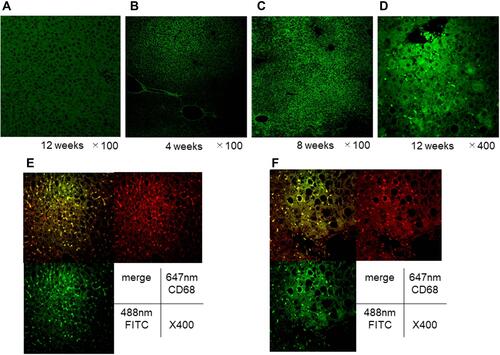
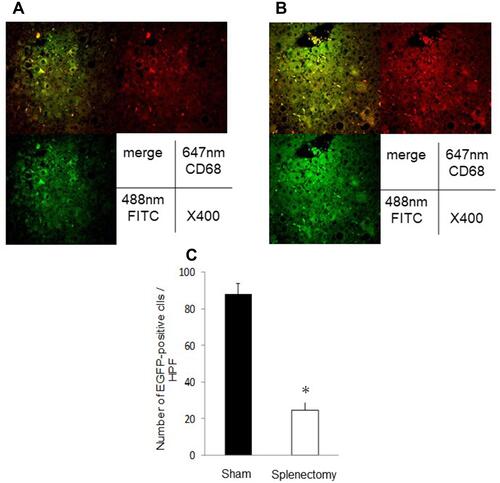
Figure 6 Double immunofluorescence staining for CD68 and F4/80 in the liver of animals with splenectomy, and the number of EGFP-positive macrophages in the liver. Representative photomicrographs are shown. (A), CD68 staining; and (B), F4/80 staining in the liver 16 weeks after bone marrow transplantation. (C), the number of EGFP-positive Mfs. Data represent means ± SEM (n = 5 in each group). *p <0.05 compared with the NASH group by ANOVA with Bonferroni’s post hoc test.