Figures & data
Table 1 Primer Sequences
Table 2 Patient Characteristics
Figure 1 Immunohistochemistry for TLR3. (A) TLR3 was not stained for tumor cells. (B) TLR3 was weakly stained around the nucleus. (C) TLR3 was strongly stained around the nucleus and weakly for the cytoplasm (Magnification: upper 40×, lower 200×).
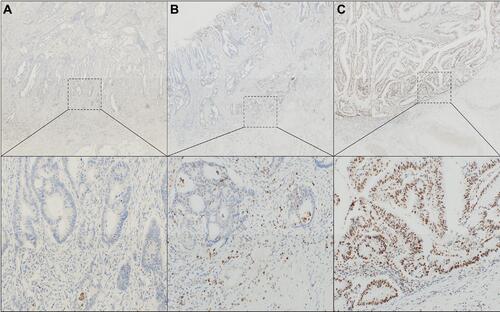
Table 3 Clinicopathological Factors in TLR3-Negative and TLR3-Positive Cases on IHC
Table 4 Univariate Analysis of 5-Year Recurrence-Free Survival (RFS)
Table 5 Results of Multivariate Analysis of Factors with a Potential Association with 5-Year Recurrence-Free Survival Using a Cox Proportional Hazard Model
Figure 2 The association of TLR3 with OS and RFS in CRC. We compared OS (A) and RFS (B) in both TLR3-positive and -negative groups. (A) There was no significant difference in OS in both groups (TLR3-positive: 80.2% vs TLR3-negative: 78.6%). (B) On the other hand, the TLR3-negative group had a significantly lower RFS than did the TLR3-positive group (TLR3-positive: 78.1% vs TLR3-negative: 46.2%), indicating that the TLR3-positive group had significantly less recurrence.
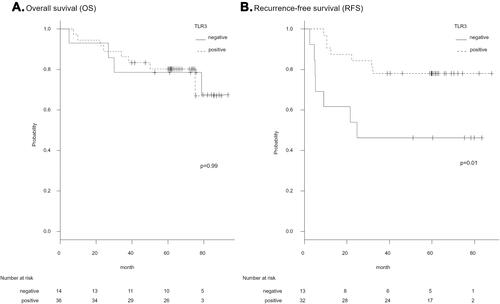
Figure 3 Western blot analysis. TLR3 is expressed in SW480; Cultured SW480 cells were treated with 0–50 µg/mL poly I:C for 24h and the cells were lysed. The lysate was subjected to Western blot analysis for TLR3 and actin. Expression of a small amount of TLR3 protein was detected even in cells without treatment with poly I:C. Significant upregulation of TLR3 protein by poly I:C was not observed.
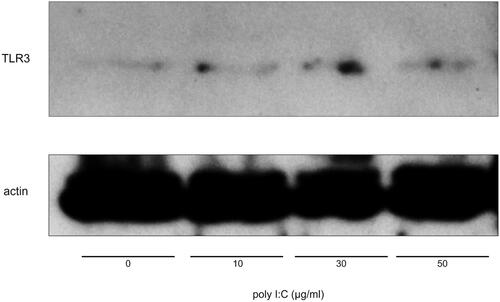
Figure 4 Treatment of SW480 with poly I:C induces the expression of CCL2, CCL5, and IL-8. (A–C) SW480 was treated with 30 µg/mL poly I:C for up to 24h, and RNA was extracted. The expression of CCL2, CCL5, and IL-8 mRNA was examined using quantitative real-time RT-PCR analysis. Poly I:C induced these mRNA in a time-dependent manner, and the expression peaked at 4h. (D–F) The cells were treated with 0–50 µg/mL poly I:C for 4h and quantitative real-time RT-PCR was performed. Treatment of SW480 with poly I:C induced the expression of these mRNA in a concentration-dependent manner. (G–I) The cells were treated with poly I:C as in (A–C), and the medium was collected. The concentration of CCL2, CCL5, and IL-8 proteins was measured using ELISAs. Poly I:C induced expression of CCL2, CCL5, and IL-8 proteins in SW480. *p-value < 0.01; Student’s t-test.
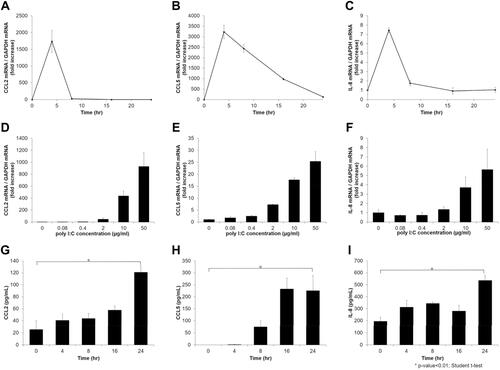
Figure 5 TLR3 is involved in the expression CCL2, CCL5, and IL-8 induced by poly I:C. SW480 were transfected with siRNA against TLR3 or non-silencing control siRNA. After 48 h, the cells were treated with poly I:C. After further incubation for 4 h and 24 h, RNA was extracted, and the conditioned medium was collected. The expressions of mRNA (A–C) and protein (D–F) for CCL2, CCL5, and IL-8 were estimated using quantitative real-time RT-PCR and ELISA, respectively. Expression of all of CCL2, CCL5, and IL-8 was upregulated by poly I:C and siRNA against TLR3 inhibited the upregulation of these molecules. *p-value < 0.01; Student’s t-test.
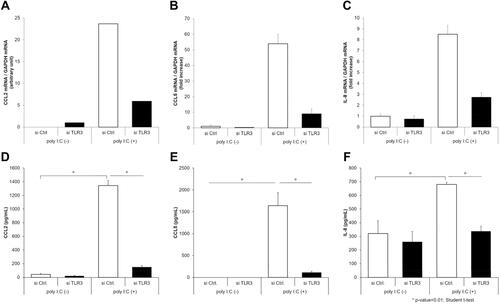
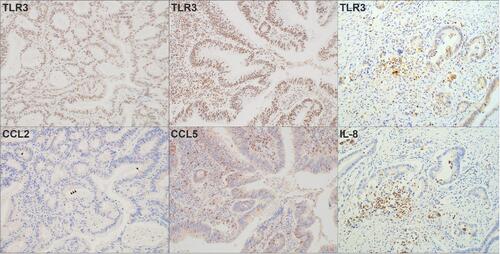
Figure 6 Immunohistochemistry for CCL2, CCL5 and IL-8 in TLR3-positive CRC in surgical specimens. In TLR3-positive CRC specimens, CCL2 was partially stained in the cytoplasm of tumor cells (arrow head). CCL5 was uniformly stained in the cytoplasm of the tumor cells and was also found in the surrounding stromal cells. IL-8 was uniformly and faintly stained in the cytoplasm of tumor cells and also stained in stromal cells (Magnification: 200×).