
Figures & data
Figure 1 Flow chart showing patient enrollment in the study.
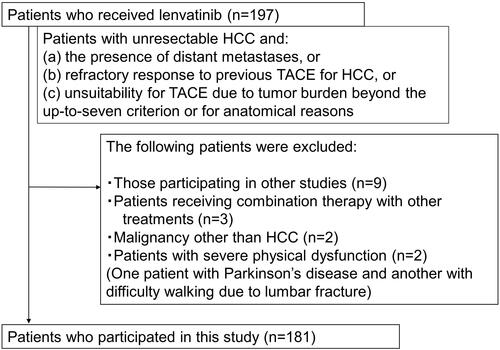
Table 1 Baseline Characteristics of Patients
Table 2A Comparison of Adverse Events According to CP Class
Table 2B Comparison of Adverse Events According to CP Class
Figure 2 Radiological response as assessed by modified Response Evaluation Criteria in Solid Tumors (mRECIST) according to Child-Pugh (CP) class (A), CP score (B), modified albumin-bilirubin (mALBI)-grade (C) and Barcelona clinic liver cancer (BCLC) stage (D).
Abbreviations: CR, complete response; PR, partial response; SD, stable disease; PD, progressive disease; NE, not estimated.
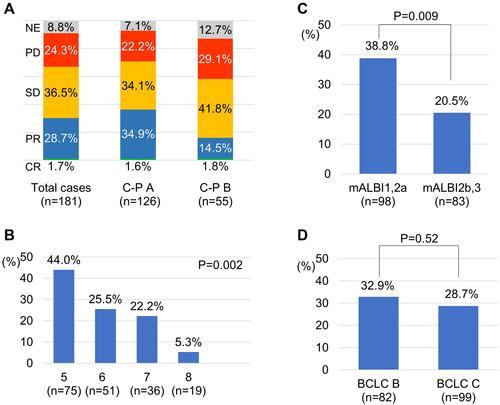
Figure 3 Association between optimal relative dose intensity (RDI) and objective response (OR) following lenvatinib treatment. Receiver operating characteristic (ROC) curve analyses of the RDI up to 8 weeks (A). Difference in OR according to RDI up to 8 weeks (B). Difference in RDI up to 8 weeks according to Child-Pugh (CP) class (C). The box plots show the median and quartiles, and the whisker caps of the box plots show the mean 10th and 90th percentile values. RDI in CP-A and CP-B patients every month from the start of treatment to 2 months later (D). AUROC, area under the ROC revealed by ROC curve analysis.
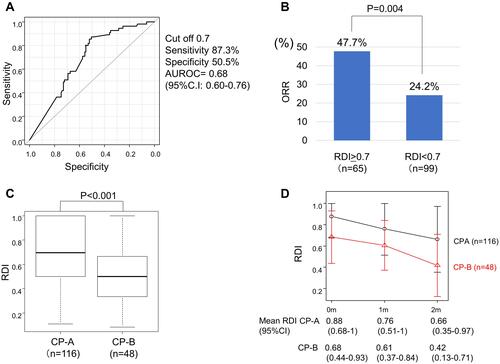
Table 3 Factors Associated with Object Response
Figure 4 Association between overall survival (OS) and several clinical factors. Kaplan-Meier analysis of 181 hepatocellular carcinoma (HCC) patients who received lenvatinib treatment, stratified by Child-Pugh (CP) class (A), modified albumin-bilirubin (mALBI)-grade (B), CP score (C), CP score of 5–7 vs 8–9 (D) and Barcelona Clinic Liver Cancer (BCLC) stage (E). Kaplan–Meier analysis of 99 BCLC-C HCC patients who received lenvatinib treatment stratified by C-P class (F).
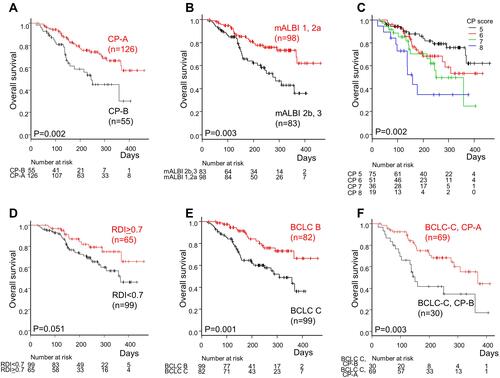
Table 4 Factors Associated with Overall Survival Time