Figures & data
Figure 1 Schematic representations of human and anaerobic bacterial metabolism of L- and D-lactate.
Notes: 1, bacterial D-LDH catalyzes a reversible reaction between pyruvate and D-lactate (allowing for D-lactate production from pyruvate) while in humans this reaction irreversibly converts D-lactate to pyruvate; 2, the anaerobic bacteria cannot dispose of pyruvate via oxidative reactions, hence all pyruvate produced from glycolysis is converted to lactate or other organic acids such as acetate and butyrate.
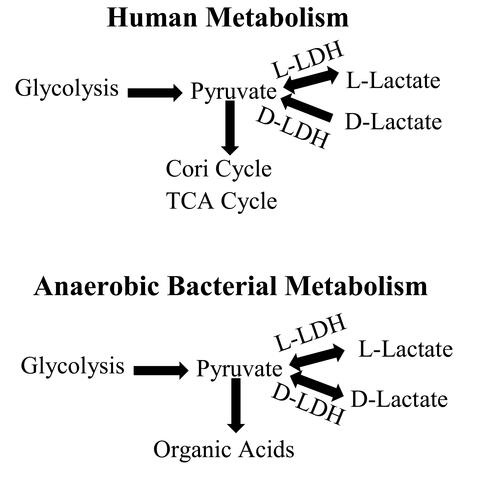
Table 1 D-Lactate Urinary Excretion (= Clearance) in D-Lactate Acidosis Patients. Renal Clearance Estimated Assuming Either a Urine Output of 1 ml/min or a Normal Plasma Creatinine (88 micromole/L) and Creatinine Clearance (100 ml/min)
Table 2 Normal Human D-Lactate Clearance Measurements
Figure 2 Comparison of the plasma D-lactate experimental data (solid circles) of Connor et al following a 20 minute, 105 millimolar constant IV infusion versus the PBPK model prediction (line) assuming a whole body clearance of 607 mL/min and Km of 5 mM.
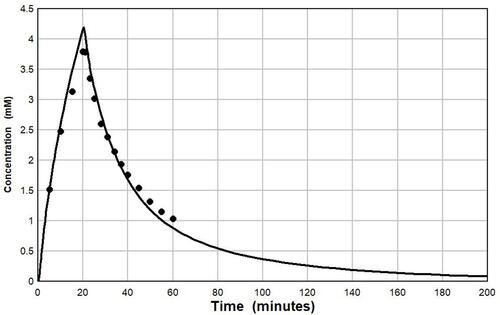
Figure 3 Plot of the PBPK model prediction of the plasma D-lactate concentration following 3 consecutive inputs of 500 millimoles of D-lactate with the time course described by Equationeq. 3(3) , each separated by 5 hours. It is assumed that the whole body clearance has the normal value of 607 mL/min. Top panel: input (see Equationeq. 3
(3) ): TT = 30 and TA = 40 minutes. Bottom panel: input TT = 30 and TA = 120 minutes.
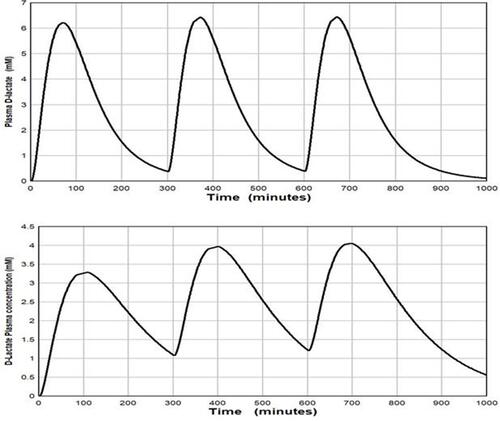
Figure 4 Left panel: De Vrese and BarthCitation40 experimental plasma D-lactate concentration following ingestion of 74 mmole of D-lactate as yoghurt (solid circles) versus the PBPK model prediction (solid line) for the normal whole body clearance of 607 mL/min. Right panel: The intestinal absorption rate used to generate the PBPK model plasma concentration (total absorption of 38.2 millimoles D-lactate, with absorption rate described by Equationeq. 3(3) : TT= 21.6 and TA = 116 minutes).
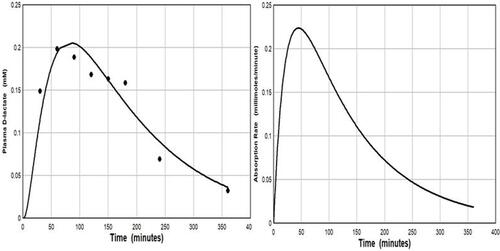
Figure 5 Schematic representation of the various processes that could influence the plasma D-lactate concentration. The direction of the solid arrows indicates whether an increase in the process potentially increases (up arrow) or decreases (down arrow) plasma D-lactate. For example, an increase in carbohydrate (CHO) ingestion would provide an increased substrate for intestinal bacteria and increase D-lactate production; while an increased CHO intestinal absorption rate would decrease the substrate for the intestinal bacteria and therefore, potentially, decrease plasma D-lactate.
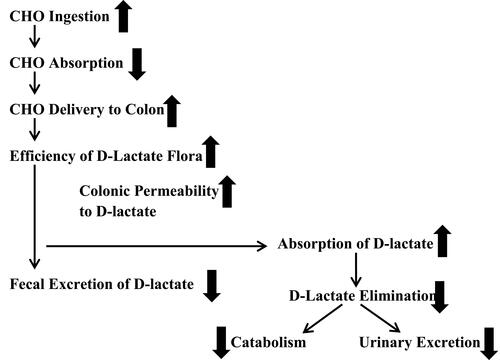
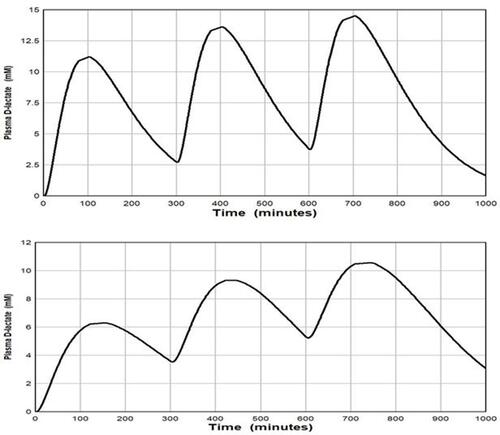
Figure 6 Plot of the PBPK model prediction of the plasma D-lactate concentration following 3 consecutive inputs of 1000 millimoles of D-lactate with the time course described by Equationeq. 3(3) , each separated by 5 hours. It is assumed that the whole body clearance has the normal value of 607 mL/min. Top panel: input (see Equationeq. 3
(3) ): TT = 30 and TA = 40 minutes. Bottom panel: input TT = 30 and TA = 120 minutes.
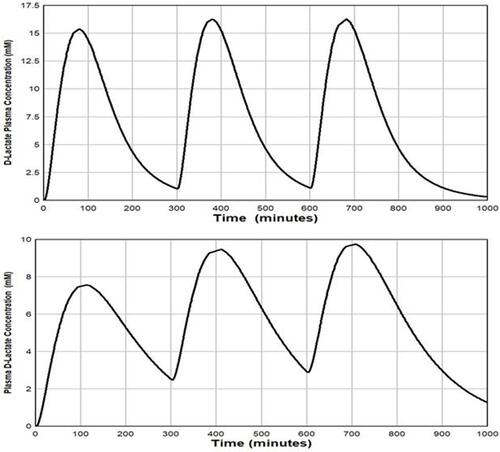
Figure 7 Plot of the PBPK model prediction of the plasma D-lactate concentration following 3 consecutive inputs of 500 millimoles of D-lactate with the time course shown in , each separated by 5 hours. It is assumed that the whole body clearance is 309 mL/min, half the normal value. Top panel: input (see Equationeq. 3(3) ): TT = 30 and TA = 40 minutes. Bottom panel: input TT = 30 and TA = 120 minutes.