Figures & data
Figure 1 Image set used for the pilot study (Phase 1). (A) Image set used for pilot study – edited for opacity; original images also shown. (B) Image set for pilot study – edited for blur radius. (C) Image set for pilot study – edited for contrast.
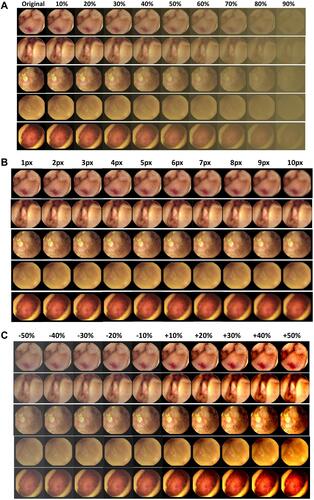
Figure 2 Some of the original images used in Phase 2. Top row: vascular lesions; middle row: inflammatory lesions; bottom row: neoplastic lesions.
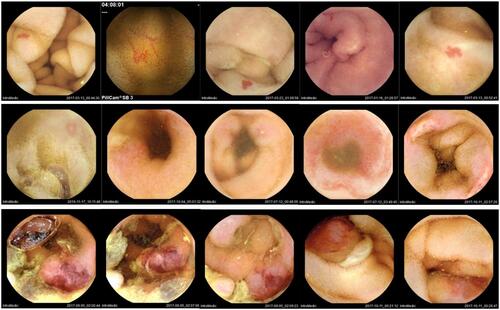
Figure 3 Continued.
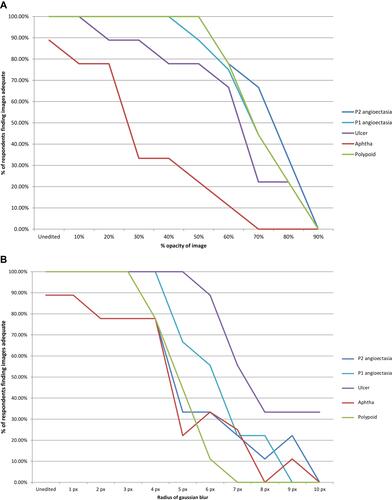
Figure 3 Results from pilot study. (A) Percentage of readers who found each image diagnostically adequate – opacity. (B) Percentage of readers who found each image diagnostically adequate – blur radius. (C) Percentage of readers who found each image diagnostically adequate – contrast.
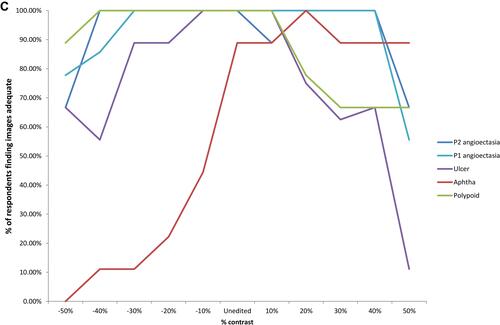
Table 1 Mean±SD of the Percentage of Reviewers Who Found Images in Each Type of Pathology Adequate for Diagnostic Purposes
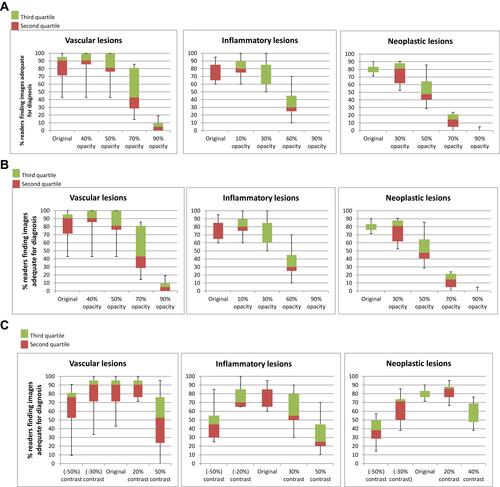
Figure 4 Results from Phase 2 of study. (A) Effects of increasing opacity in Phase 2, shown as median and spread of responses for each set of lesions. (B) Effects of increasing blur radius in Phase 2, shown as median and spread of responses for each set of lesions. (C) Effects of decreasing and increasing contrast in Phase 2, shown as median and spread of responses for each set of lesions.