
Figures & data
Figure 1 (A) Determination of body weight parameters (p <0.001): a significant difference between groups is observed starting in the sixth week. * significant effect of the high-fat and choline-deficient diet according generalized estimating equations (GEE) followed by Bonferroni’s test. (B) Delta Lee index, *significant effect of the high-fat and choline-deficient diet (p = 0.017). Data expressed as mean ± standard deviation, Student’s t-test. Each experimental group with 10 male Sprague Dawley rats.
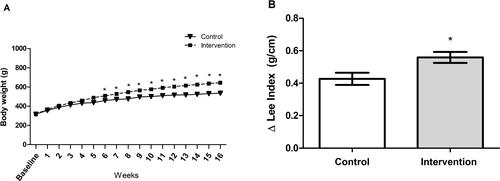
Figure 2 (A) Abdominal circumference, (B) abdominal adipose tissue, (C) macroscopic appearance of liver in the control group, (D) macroscopic appearance of liver in the intervention group, (E) liver weight and (F) liver weight/body weight ratio of the animal. *Significant effect of the high-fat and choline-deficient diet (p < 0.001). Data expressed as mean ± standard deviation, Student’s t-test. Each experimental group with 10 male Sprague Dawley rats.
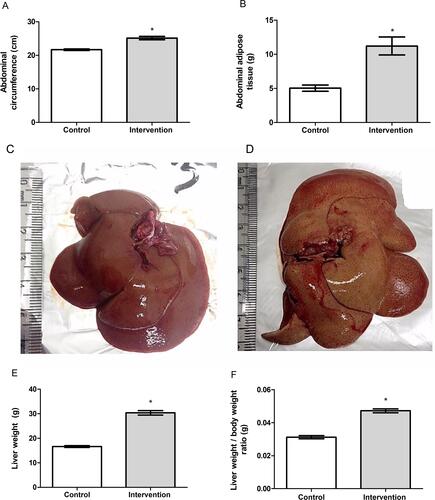
Table 1 Biochemical Parameters of Animals Fed with HFCD Diet versus Standard Diet
Figure 3 Quantitative analysis of fat deposition in liver tissue *Significant effect of the high-fat and choline-deficient diet (p < 0.001). Data expressed as mean ± standard deviation, Student’s t-test. Each experimental group with 10 male Sprague Dawley rats.
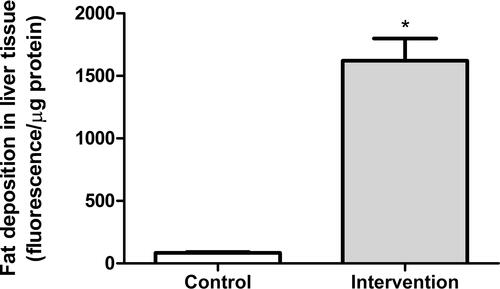
Table 2 Changes in Liver Concentration of Pro- and Anti-Inflammatory Cytokines Related to Pathophysiology of NASH
Table 3 Gene Expression of Gut Permeability Markers and Hepatic Inflammation Involved in NASH Pathogenesis
Figure 4 Gene expression of the circulating microRNAs. (A) mir-122 (p = 0.041), (B) miR-145 (p = 0.010) and (C) miR-143 (p = 0.199). *Significant effect of the high-fat and choline-deficient diet. Data expressed as median (25th-75th percentile), Mann–Whitney U-test. Each experimental group with 10 male Sprague Dawley rats.
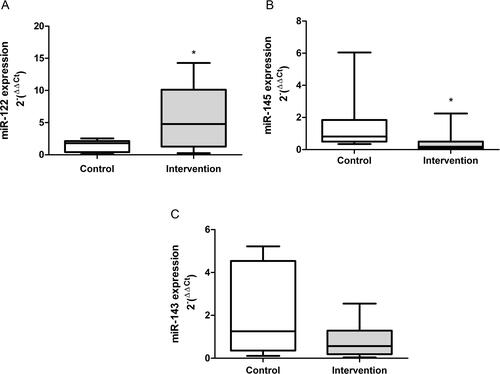
Figure 5 Gut microbiota features in control and intervention. (A) Hierarchical clustering dendrogram based on the Bray-Curtis dissimilarity index, (B) Number of OTUs, (C) Relative abundance, (D) distribution of the eight observed phyla and (E) Histogram of the LDA scores (log10) computed for the four differentially abundant phyla. Each experimental group with 10 male Sprague Dawley rats.
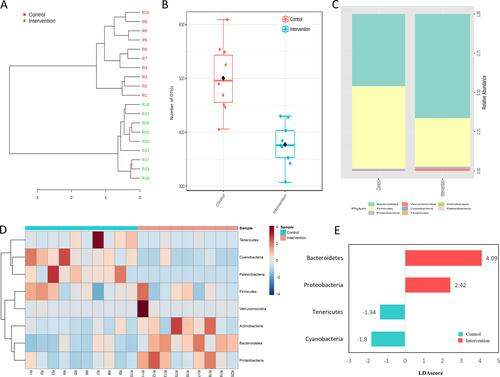
Table 4 Distribution of Liver Histopathological Findings
Figure 6 Liver histological evaluation. Images referring to the control (A) and intervention (C) groups, H&E staining and both at 40X magnification. Picrosirius staining in the control (B) and intervention (D) groups, both at 10X magnification. (E) Quantification of collagen fibers. *Significant effect of the high-fat and choline-deficient (p < 0.001). Data expressed as median (25th-75th percentile), Mann–Whitney U-test. Each experimental group with 10 male Sprague Dawley rats.
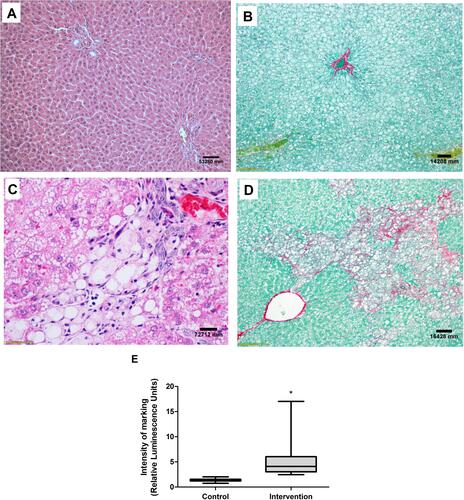
Figure 7 Small intestine histological evaluation. Images referring to the control group without injury (A); moderate injuries (B) and severe lesions (C) in the intervention group. H&E staining and both at 40X magnification. Each experimental group with 10 male Sprague Dawley rats.
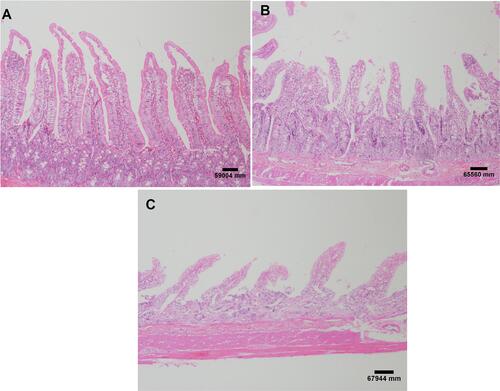
Table 5 Correlations Between NASH Markers and Microbiota Composition