Figures & data
Table 1 Demographic and Clinical Phenotype of Studied Patients
Figure 1 Comparable immune cell frequencies among studied patients and controls. Figure displays frequency of (A) memory CD3+CD45RO+ T cells and (B) α4β7+ and α4β7− memory T cells in control subjects and patients with CD or UC.
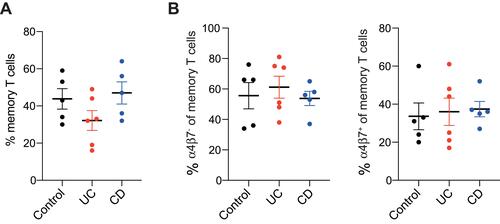
Figure 2 Polyclonal TCRβ repertoire characterizes circulating α4β7+ memory T cells. (A) Representative treemap images showing repertoire landscape in a control subject and patients with UC and CD. (B) Cumulative percentage of top 100 clones followed by representation of markers of diversity, including (C) Shannon’s H, (D) Simpson’s D and (E) clonality.
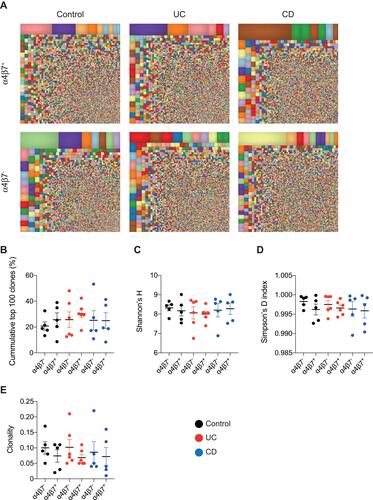
Figure 3 High degree of clonal overlap between α4β7+ and α4β7− memory T cells. (A) Representative pair-wise scatters between α4β7+ and α4β7− memory T cells in a control subject, and patients with UC or CD, followed by (B) cumulative analysis.
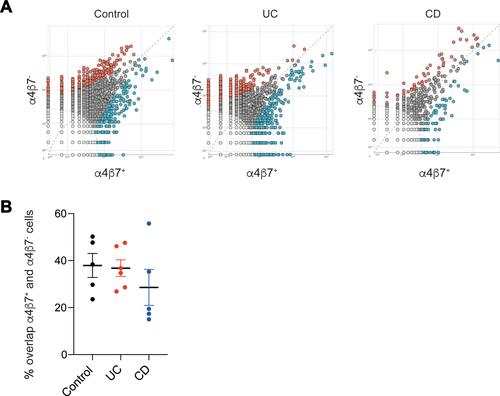
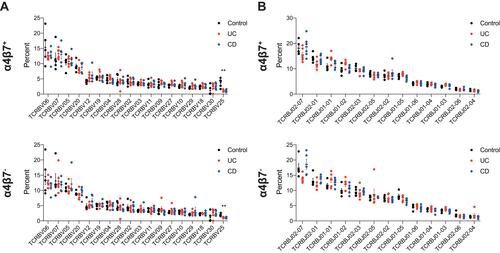
Figure 4 TRB gene usage in control subjects and IBD patients. Comparison of usage of the (A) TRBV genes and (B) TRBJ family genes in α4β7+ (top panel) and α4β7− (bottom panel) memory T cells in control subjects, patients with UC and those with CD. For TRBV figures depict only genes with >1% frequency. **P value=0.002.