Figures & data
Table 1 Demographic and Anthropometric Features of Included Patients
Table 2 Laboratory Values of the Study Group
Figure 1 Serum Triglyceride levels of subgroups.
Abbreviations: NAPS, Nonalcoholic pancreatic steatosis; NAFLD, Nonalcoholic fatty liver disease.
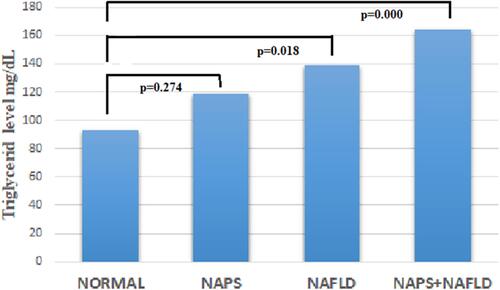
Figure 2 Venn diagram of NAPS and NAFLD.
Abbreviations: NAPS, Nonalcoholic pancreatic steatosis; NAFLD, Nonalcoholic fatty liver disease.
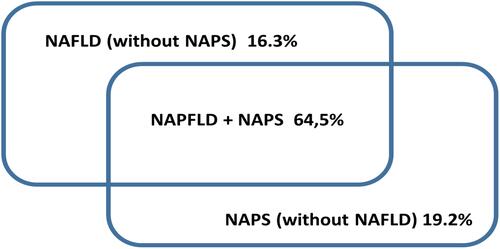
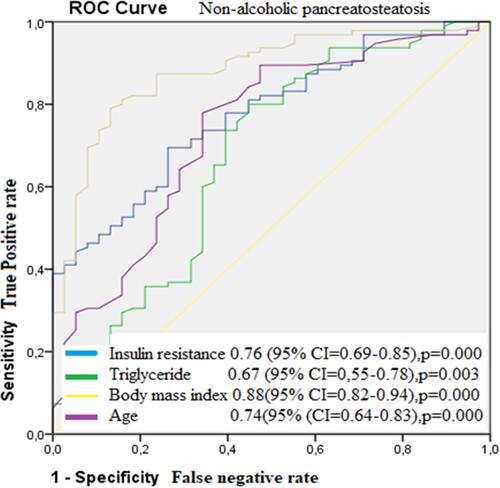
Figure 3 Receiver operating characteristic (ROC) curve for insulin resistance, triglyceride, body mass index, and age in nonalcoholic pancreatic steatosis area under the ROC curve.