Figures & data
Table 1 Characteristics of patients with peptic ulcer perforation (cases) and nonperforation (controls)
Table 2 Regression coefficient, risk ratio, and 95% confidence interval of diagnostic indicators for peptic ulcer perforation from logistic regression
Figure 1 Receiver operating characteristic curve of risk for peptic ulcer perforation predicted by risk scoring (curved line) and a 50% chance prediction (diagonal line).
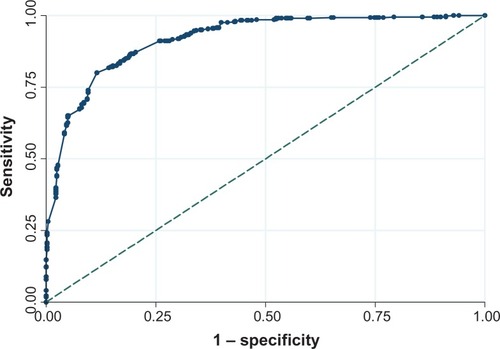
Table 3 Item scoring scheme for predictors of peptic ulcer perforation derived from coefficients of select diagnostic indicators
Figure 2 Score predicted risk (dots) and logistic estimated risk (solid line) of peptic ulcer perforation (%) for each total score.
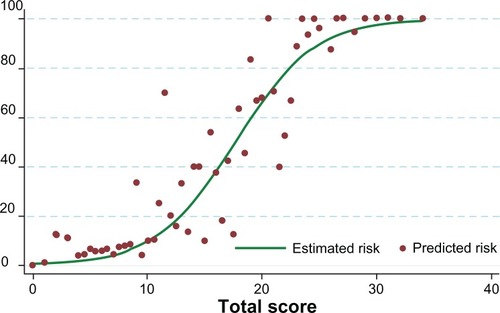
Table 4 Distribution of risk for perforation among patients with peptic ulcer perforation and nonperforation